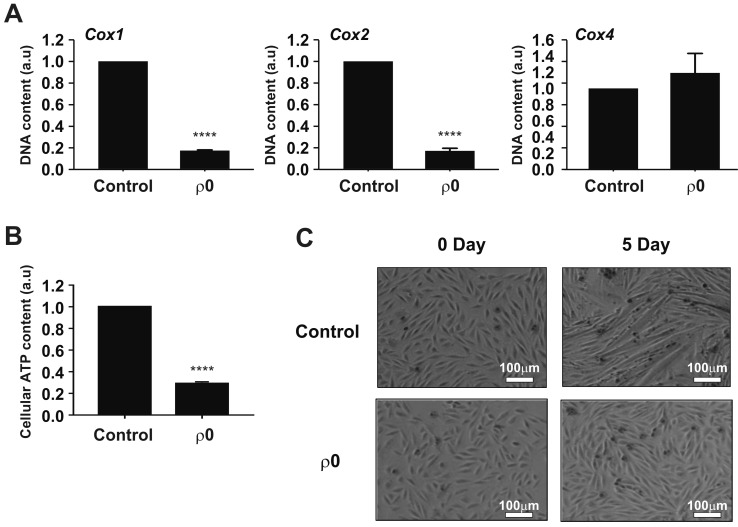
Fig. 1. Characterization of mtDNA-depleted L6 GLUT4myc myocytes.
(A) Comparison of cytochrome oxidase I (COX1), COX2, and COX4 levels between normal L6 GLUT4myc myocytes (control) and mtDNA-depleted L6 GLUT4myc myocytes (ρ0 myoblasts) using real-time PCR. Relative intensities are presented as normalized values with the intensity of control set to 1. ****p<0.0001. (B) Comparison of total cellular ATP level between control and ρ0 myoblasts. ATP contents expressed as normalized value, which was set to 1. ****p<0.0001. (C) Comparison of differentiation of myoblasts into myotubes between control and ρ0 myoblasts.

