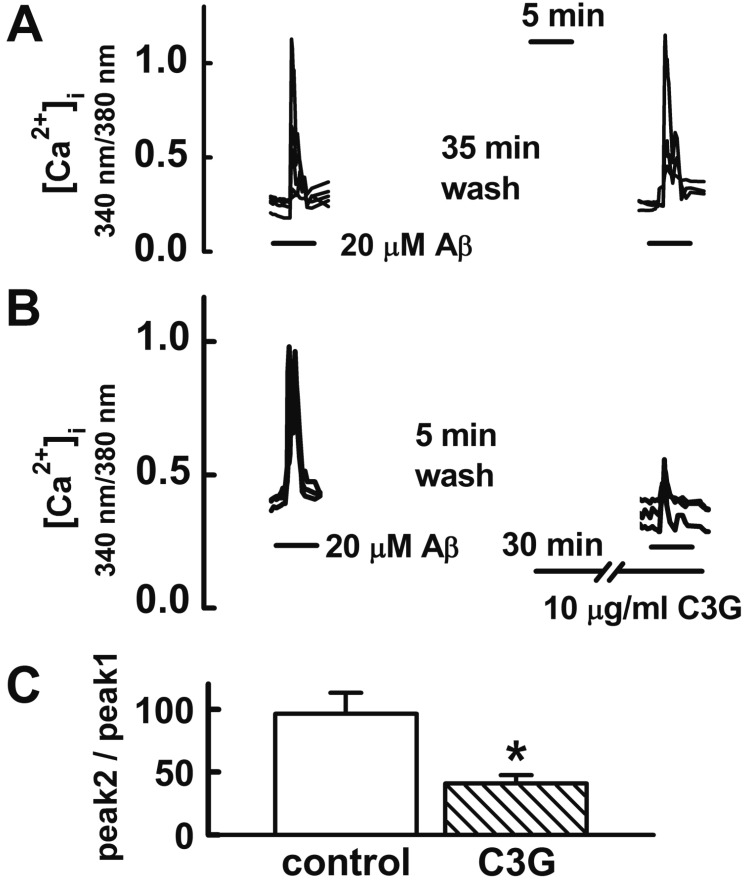
Fig. 2. Effects of C3G on Aβ25–35-induced [Ca2+]i increases.
Reproducible [Ca2+]i increases were elicited by applying Aβ25–35 (20 µM) for 5 min at 35 min intervals (A). Pretreatment with C3G (10 µg/ml) for 30 min significantly inhibited Aβ25–35-induced [Ca2+]i responses (B). (C) Summary of the Aβ25–35-induced [Ca2+]i increases in non-treated (control, n=17) and C3G-pretreated (C3G, n=10) cells. Aβ25–35 induced response is presented as a percentage of the initial Aβ25–35 induced response (peak 2/peak 1). Data are expressed as mean±S.E. *p<0.05 relative to control (non-paired Student's t-test).

