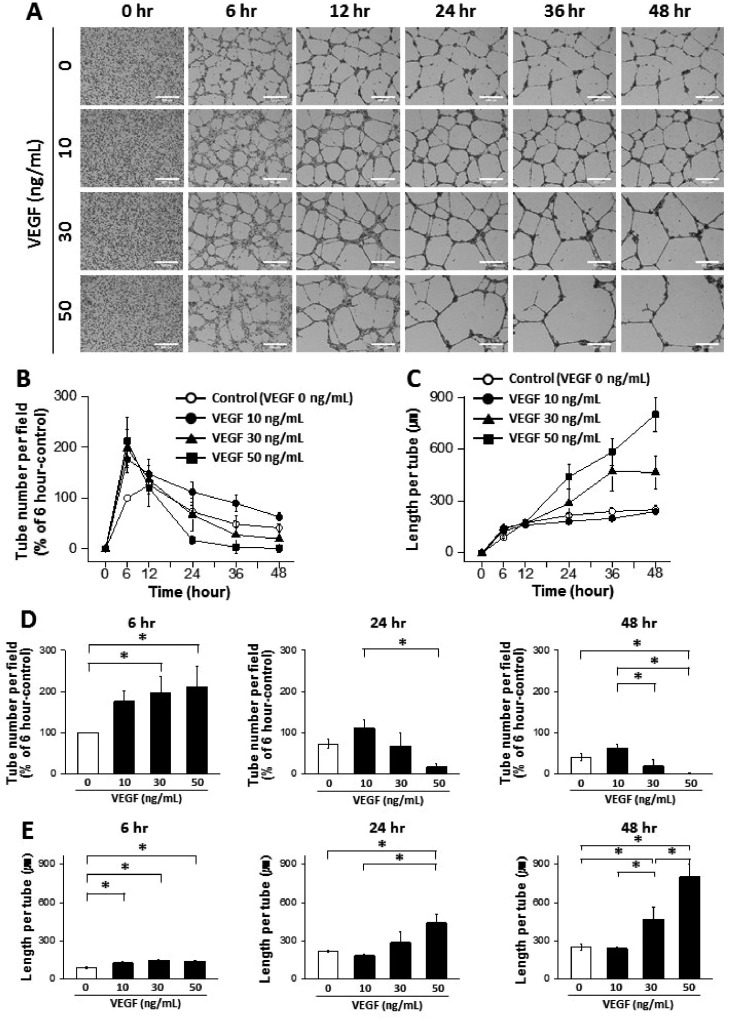
Fig. 3. Dynamic progression of tube formation from human endothelial colony forming cells (ECFCs) with treatment of vascular endothelial growth factor (VEGF).
(A) Representative images of the tubular structures formed by ECFCs over 48 h in the presence and absence of VEGF (scale bar=500 µm). (B) Graph of the tube number over 48 h in the presence and absence of VEGF. (C) Graph of the length per tube over 48 h in the presence and absence of VEGF. (D) Statistical analysis of the tube number comparing 6, 24, and 48 h. (E) Statistical analysis of the length per tube comparing 6, 24, and 48 h. The asterisk (*) indicates a significant difference (p≤0.05) between groups (n=3–4).

