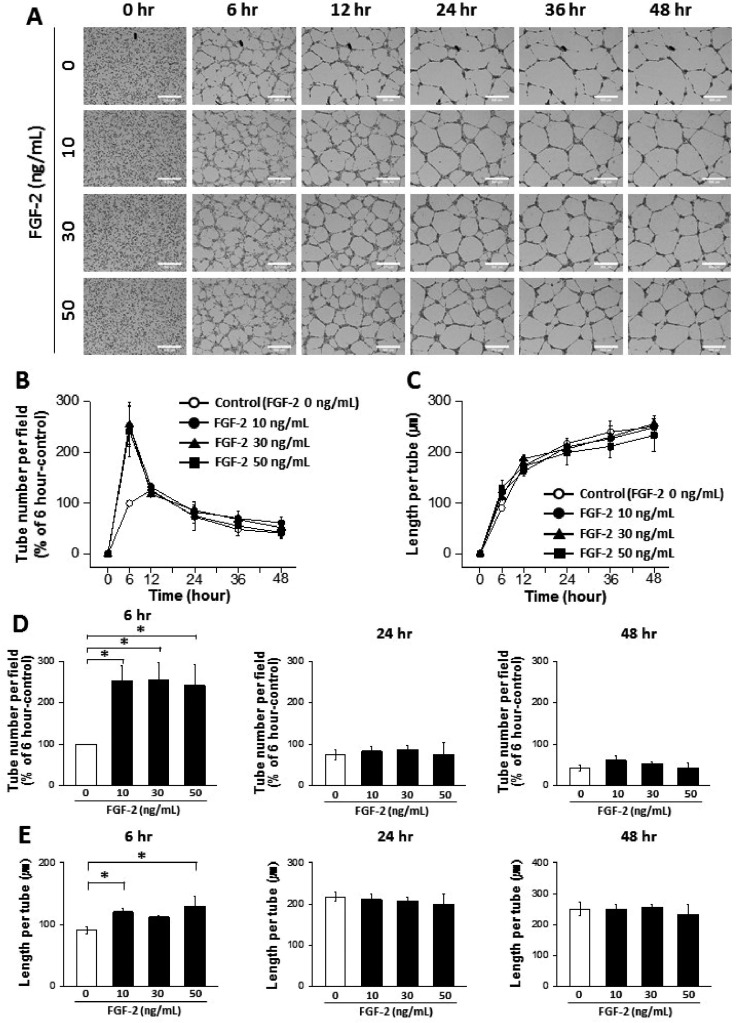
Fig. 4. Dynamic progression of tube formation from human endothelial colony forming cells (ECFCs) with treatment of fibroblast growth factor-2 (FGF-2).
(A) Representative images of the tubular structures formed by ECFCs over 48 hours in the presence and absence of FGF-2 (scale bar=500 µm). (B) Graph of the tube number over 48 hours in the presence and absence of FGF-2. (C) Graph of the length per tube over 48 hours in the presence and absence of FGF-2. (D) Statistical analysis of the tube number comparing 6, 24, and 48 hours. (E) Statistical analysis of the length per tube comparing 6, 24, and 48 hours. The asterisk (*) indicates a significant difference (p≤0.05) between groups (n=3–4).

