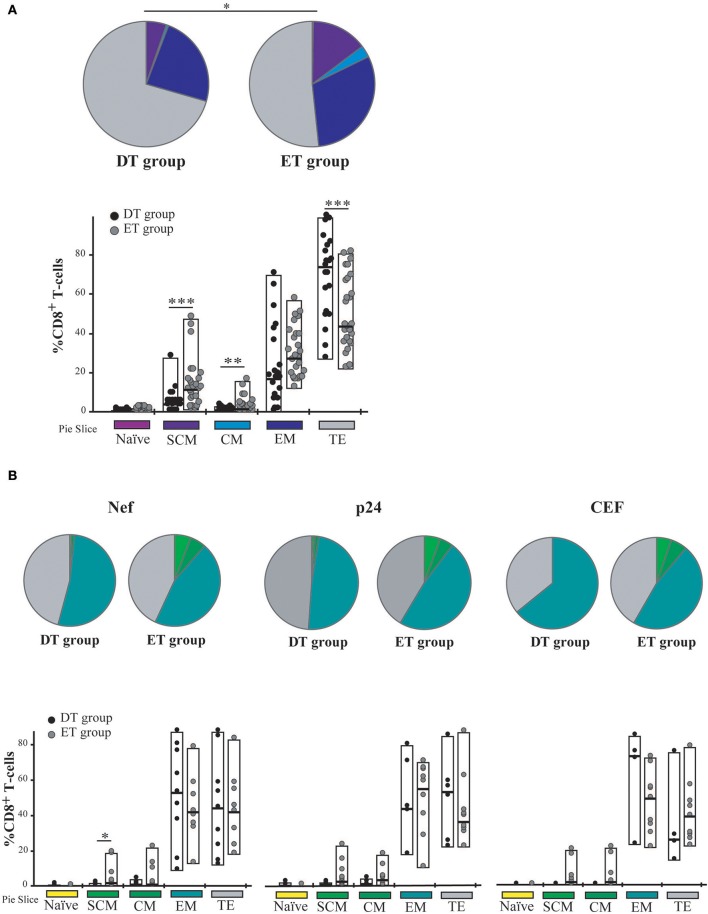
Figure 4.
Memory/effector phenotype analysis on expanded CD8+ T-cells from DT and ET individuals. (A) Distribution of effector/memory subsets in bulk CD8+ T-cells analyzed post-expansion. DT, Delayed treatment (N = 11 subjects, total 22 responses); ET, Early treatment (N = 13 subjects, total 26 responses). (B) Distribution of effector/memory subsets in Nef-, p24-, and CEF-specific CD8+ T-cells, identified on the bases of cytokine production and/or degranulation capacity. DT, Delayed treatment (N = 10 Nef-specific responses, N = 8 p24-specific responses, N = 5 CEF-specific responses); ET, Early treatment (N = 12 Nef-specific responses, N = 12 p24-specific responses, N = 10 CEF-specific responses). In (A,B), analyses were performed with SPICE software. In bar graphs, the color code shown at the bottom mirrors the one shown in the pies. Black dots represent DT subjects and gray dots represent ET subjects. Boxes extend from min to max, horizontal bar within boxes represent median values. When analyzing global distribution (pies) permutation tests were applied, instead when analyzing bar graphs, Student T-test were used. *p ≤ 0.05; **p ≤ 0.01; ***p ≤ 0.005. SCM, Stem cell memory; CM, Central memory; EM, Effector memory; TE, Terminal effector.

