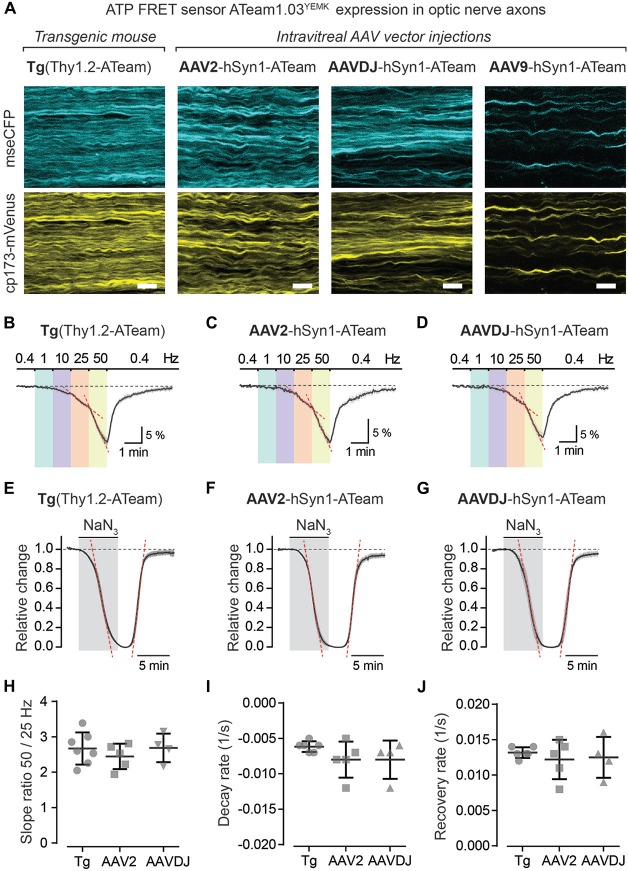
Figure 6.
Axonal ATP sensor imaging following intravitreal AVV vector injections. (A) Example two-photon scan images of axons expressing the ATP sensor (ATeam1.03YEMK) in acute optic nerve preparations from a transgenic mouse [B6-Tg(Thy1.2-ATeam1.03YEMK)AJhi] and from mice with intravitreal injection of AAV vectors [hSyn1-ATeam1.03YEMK-WPRE-hGHp (A)]. Efficacy of sensor expression (number of axons) differs between the AAV vector serotypes tested, with AAV2 and AAVDJ revealing abundant expression whereas with AAV9 only very sparse axonal expression is detected. Both channels, mseCFP (blue) and cp173-mVenus (yellow), of the FRET sensor are depicted. Scale bars 10 μm. (B–D) Average time course of relative changes in axonal ATP levels upon stepwise increase in stimulation frequency in nerves from transgenic mice (n = 7; B) and from nerves following intravitreal AAV injections of serotypes AAV2 (n = 5; C) and AAVDJ (n = 4; D). Changes (in % ± SEM) are presented relative to the 0.4 Hz BL. (E–G) Relative ATP level changes in axons during and after mitochondrial respiration block, by 5 mM NaN3 bath application for 6 min, in nerve preparations from transgenic mice (E), AAV2 (F) and AAVDJ (G) injected mice. To evaluate kinetics of ATP level changes (i.e., decay and recovery rates) the time course of the Venus/CFP ratios is normalized to BL (before NaN3 application; set as 1) and to the plateau level reached with NaN3 (set as 0). Depicted are averaged time courses from 4 to 7 nerves ± SEM. (H) Axonal ATP levels drop faster (i.e., increase in ATP consumption) with higher stimulation frequencies (B–D) and is exemplified here by calculating the ratios of the ATP level decline slopes (red dashed lines in B–D) upon 50 and 25 Hz stimulations. A two-fold increase in stimulation frequency reveals on average a 2.7 ± 0.4 (Tg), 2.4 ± 0.4 (AAV2) and 2.7 ± 0.4 (AAVDJ) fold increase in ATP level drop. No overt differences between groups, n = 4–7 ± SD, Welch’s t-test. (I,J) Summary plots of axonal ATP level decay (I) and recovery (J) rates from NaN3 experiments (in E–G). Rates (per s) were determined by linear regression between 25% and 75% of the normalized decay and recovery curves (red dashed lines in E–G; R2 of linear fits ≥0.98). Average decay rates (I) are −0.006 ± 0.0003 (Tg), −0.008 ± 0.001 (AAV2) and −0.008 ± 0.001 (AAVDJ) and average recovery rates (J) are 0.013 ± 0.0003 (Tg), 0.012 ± 0.001 (AAV2) and 0.012 ± 0.001 (AAVDJ). No overt differences between groups, n = 4–7 ± SD, Welch’s t-test.

