FIGURE 2.

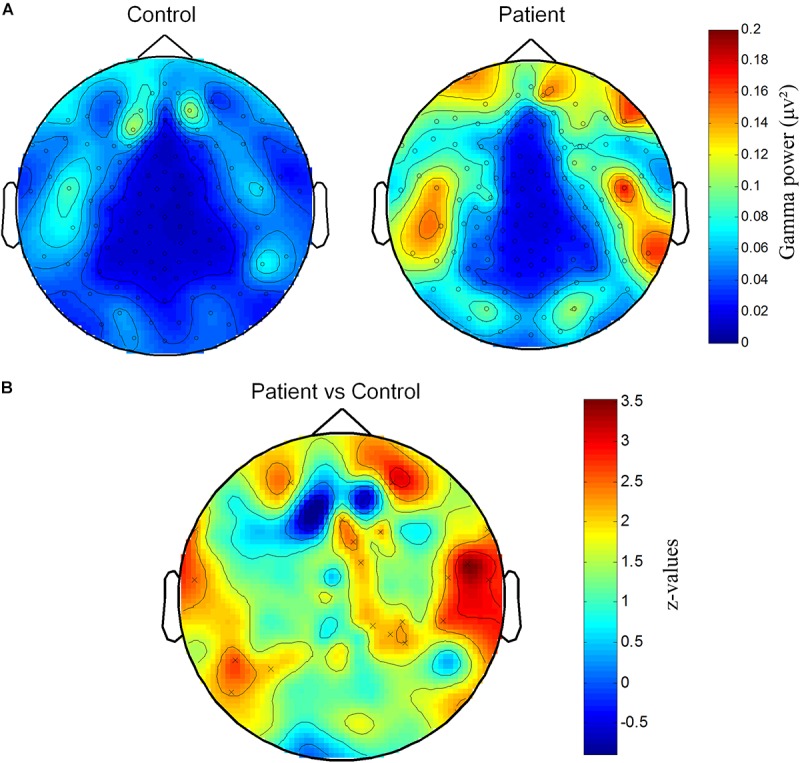
Spatial distribution of increased gamma power at channels on parietal and temporal areas. (A) Topography of gamma power for Patient and Control groups. Gamma power (μV2) is color-coded. (B) Significantly different distribution of gamma power between Patient group and Control group. Z-values representing the statistical comparison between two groups are color-coded. “×” marks the cluster that significantly higher in Patient group.
