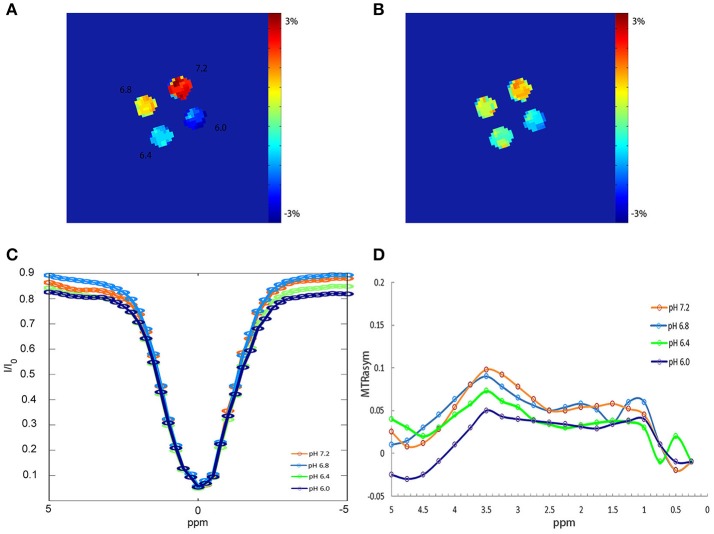
Figure 2.
APTW imaging, Z spectra and MTRasym curves of BSA phantoms. (A) APTW imaging of 4 20% BSA phantoms with difference pH (6.0, 6.4, 6.8, 7.2) measured at a width of 40 ms, a flip of 340°, duty cycle of 50% and the number of saturation pulse of 50. (B) APTW imaging of 4 different pH BSA phantoms measured at a width of 40 ms, a flip of 180°, duty cycle of 50%, and the number of saturation pulse of 50. (C,D) Z spectra and MTRasym curves of 4 different pH BSA phantom measured with a flip of 340°.

