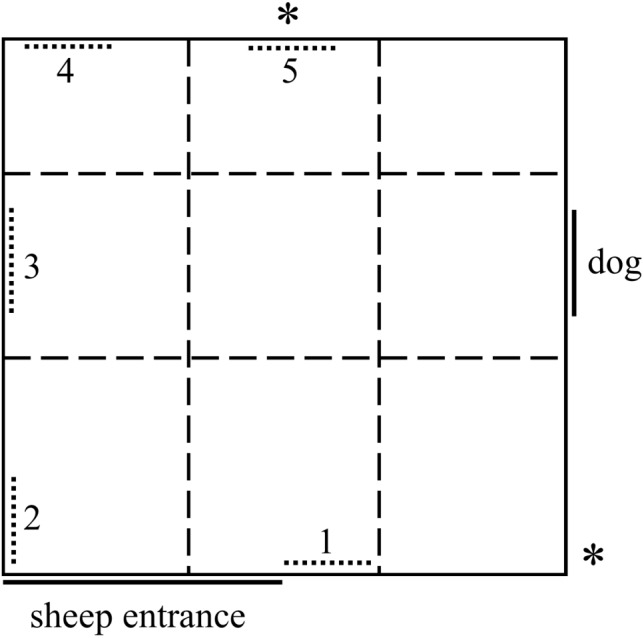
FIGURE 1.

Diagram of the attention bias test arena comprising a 4 m × 4.2 m yard with opaque 1.8 m high walls. A dog was visible for the first 3 s of the test, then the window was covered. The numbered, dotted lines represent potential locations of positive stimuli during the pilot study. Only position 3 was used during the main trial. “∗” Denotes the positions of two cameras. Dashed lines represent a grid overlaid on video footage post-testing.
