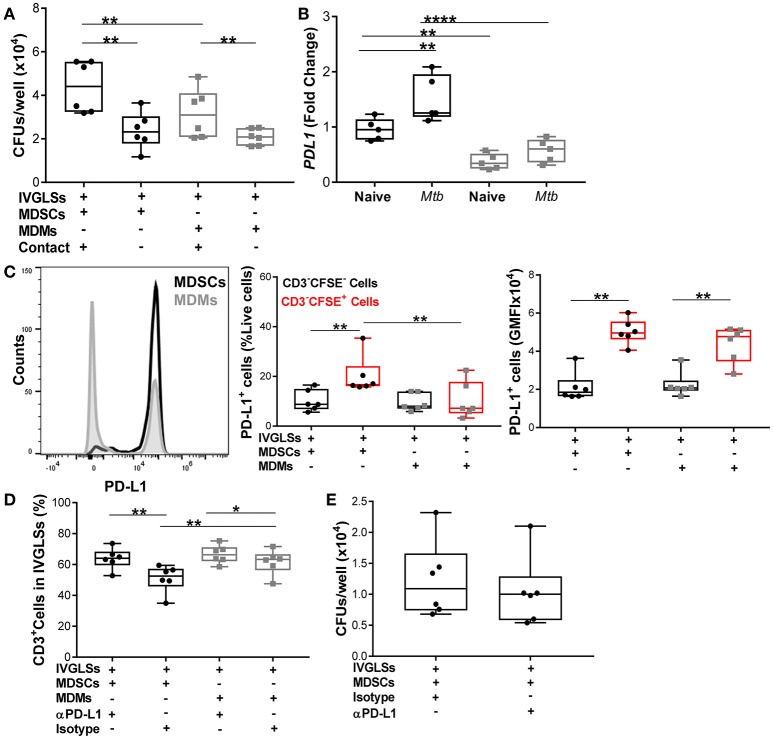
Figure 8.
Numbers of CD3+ cells but not Mtb growth are regulated via PD-L1 in IVGLSs-MDSCs co-cultures. (A) Bacterial loads in IVGLSs at 48 h following addition of MDSCs/MDMs with or without direct contact (using trans wells), that is at day 7 post IVGLSs generation. (B) PDL1 expression in monocultures of MDSCs and MDMs at 4 h post Mtb infection (MOI 20). (C) CFSE-tracked MDSCs or MDMs were co-cultured with IVGLS and PD-L1 surface expression was monitored in CFSE− and CFSE+ fractions of cells from each culture condition, where CFSE− cells represent myeloid cells of IVGLSs present before initiation of the co-cultures. (D) Frequency of CD3+ T-cells at day 7 IVGLSs, that is after 48 h IVGLS post co-culturing with MDMs/MDSCs, with or without simultaneous PD-L1 neutralization (10 μg/ml αPD-L1 or isotype control). (E) Day 7 bacterial loads in IVGLSs wells and applying for the last 48 h PD-L1 neutralization and MDSC co-culturing. Data are pooled from 2 independent experiment (n = 5 individuals) (B) and (n = 6 individuals) (A,C–E), shown are median±IQR; two-way ANOVA with Bonferroni correction (B) and paired Student's t-test (A,C–E), *p ≤ 0.05, **p ≤ 0.01, ****p ≤ 0.0001.

