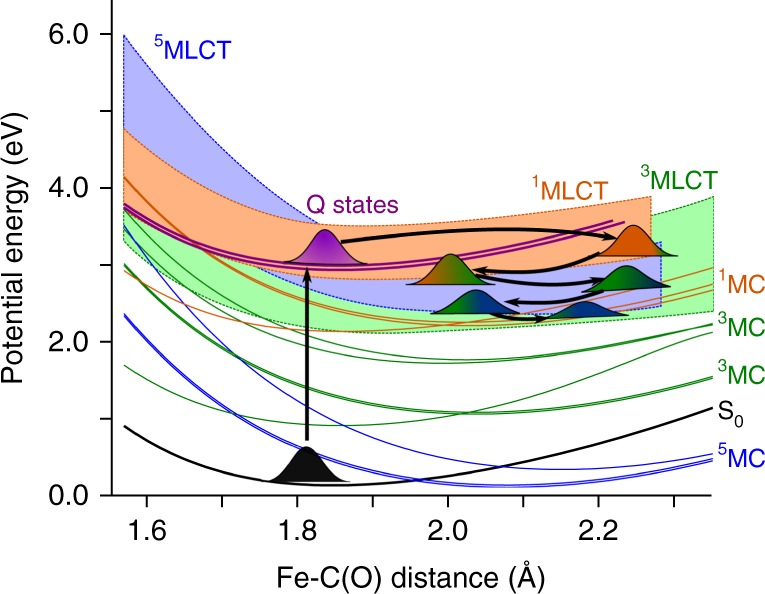
Fig. 2.

Potential energy surface along a dissociative mode. Plot of the potential energy surfaces along the Fe–C(O) distance. The LS state S0, and the 1Q states are shown in black and magenta, respectively. The singlet manifold is shown in orange, the triplet manifold in green and the quintet manifold in blue. The metal-centered (MC) states are shown explicitly, whereas the metal-to-ligand charge transfer (MLCT) states are depicted as a quasi-continuous band. Further, a schematic evolution of the wavepacket dynamics is shown. After absorption to the Q-band, the wavepacket undergoes large-amplitude oscillations in the Fe–CO coordinate on the 1MLCT state. Then, it cascades down acquiring more 3MLCT and 5MLCT character as the spin crossover transitions occur. Finally, the wavepacket disperses, and the Fe–C(O) distance oscillations decrease to a value of 2.2 Å
