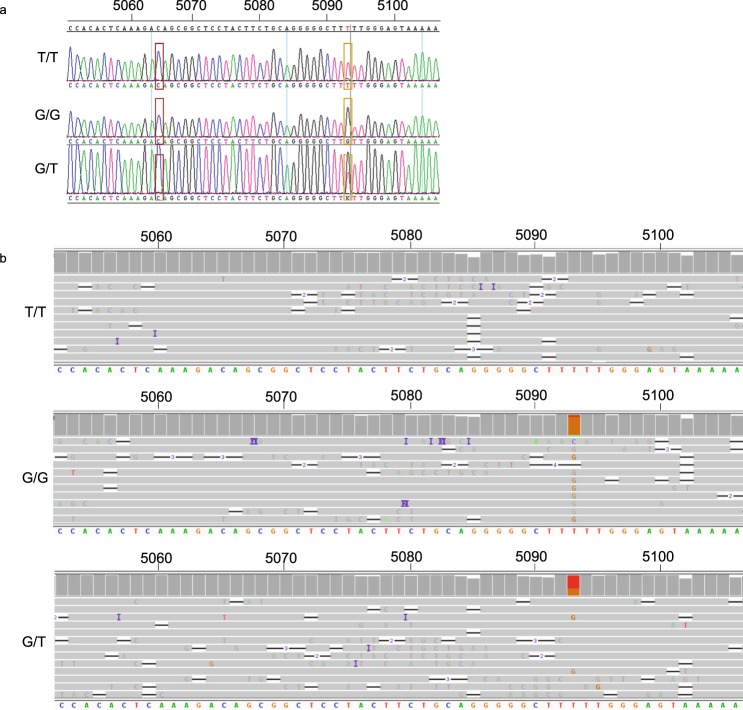
Figure 3.
Detection of V158F polymorphism by showing 3 different genotypes, homozygous T, homozygous G, and heterozygous. (a) Electropherograms show the Sanger-based sequencing result around the V158F polymorphism. The red square indicates nucleotide position 5064, which is used to check whether the FCGR3B gene is co-amplified. The yellow square indicates nucleotide position 5093, used for determining the V158F polymorphism. Nucleotide code K indicates that both T and G are present. (b) MinION sequencing result around the V158F polymorphism. Dark grey bars on the top show the sequence coverage identical to the consensus sequence. If the sequence is not identical to the consensus the bars will have the color of the corresponding nucleotide. The light grey lines show a small part of the reads obtained with the MinION run and the sequence at the bottom shows the consensus sequence. The first result represents a sample homozygous for T at position nucleotide 5093 (coverage: A: 0%: C: 2% G: 2% T: 96%), which was also used as consensus, the second sample is homozygous for G (coverage: A: 3% C: 2% G: 85% T: 9%), and the third is heterozygous at nucleotide position 5093 (coverage: A: 1% C: 3% G: 32% T: 64%).

