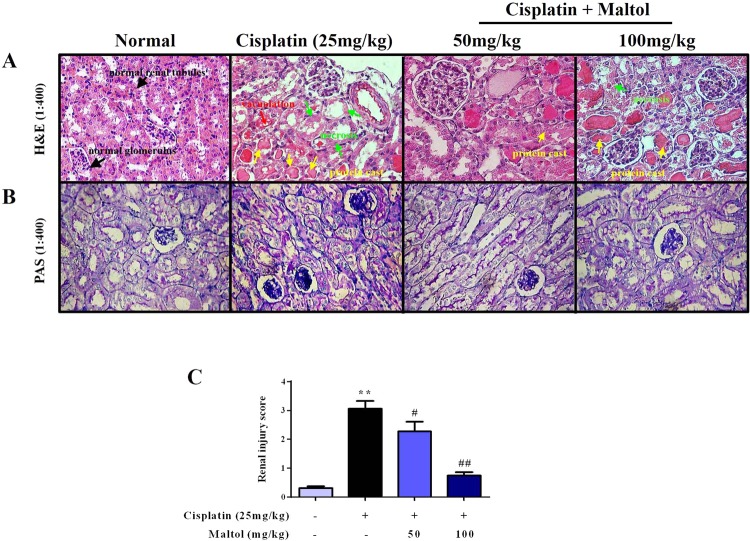
Figure 2.
Maltol attenuated cisplatin-induced morphological changes. (A,B) H&E staining and PAS stain of kidney sections from normal group, cisplatin group, maltol (50 mg/kg) + cisplatin group and maltol (100 mg/kg) + cisplatin group. Note: The condensation of the cell necrosis (green arrow) and protein cast (yellow arrow) in cisplatin mice. Red arrows refer to vacuolization of the renal cortex (magnification ×400). The renal injury score (C) was determined. All values were expressed as mean ± S.D. **p < 0.01 vs. normal group; #p < 0.05, ##p < 0.01 vs. cisplatin group.

