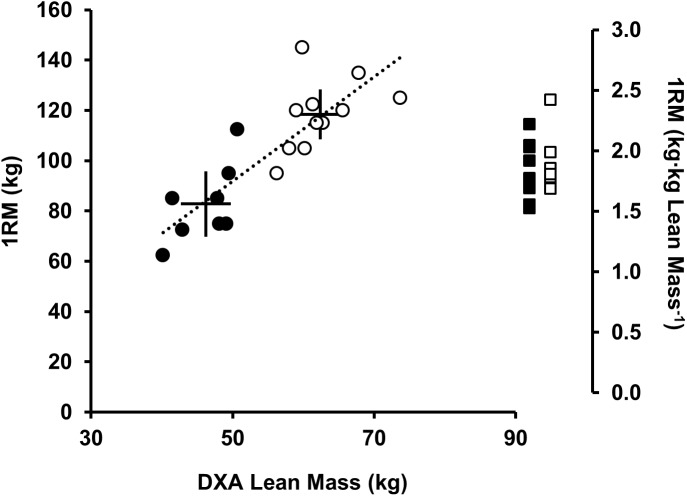
FIGURE 2.
Relationship between DXA lean mass (kg) and 1RM back-squat strength (kg; left axis), men (open circles), and women (black circles). Solid lines represent the mean (intersection) and 90% CI. Dotted regression line shows strong positive correlation between DXA lean mass (kg) and 1RM (kg) (r2= 0.71, P < 0.001). Sex differences were observed for lean mass (kg) and 1RM (kg) (P < 0.05) but not 1RM [(kg⋅kg lean mass-1) (P = 0.401), men (open squares), and women (black squares)].

