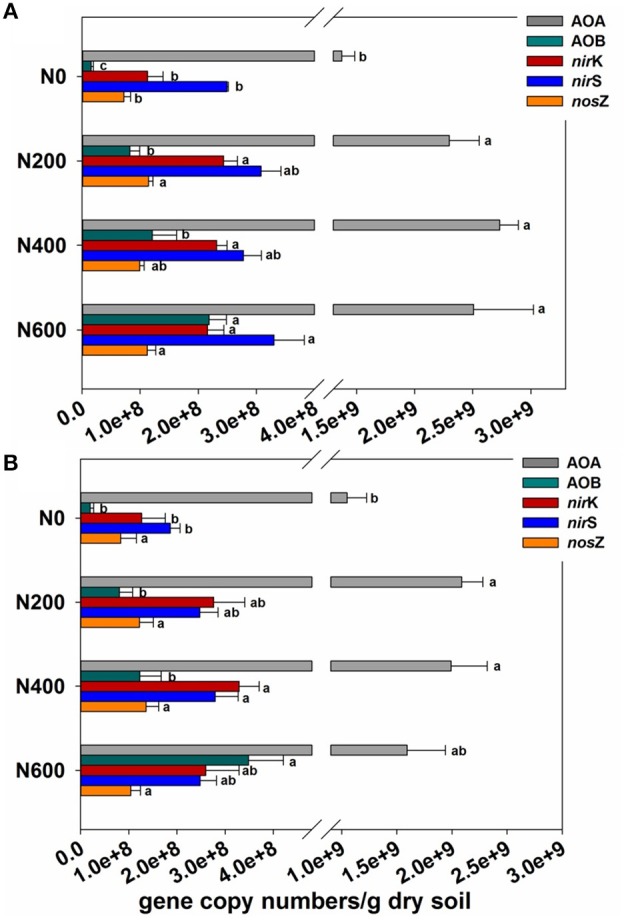
Figure 1.

(A,B) The abundance of ammonia-oxidizing archaea (AOA) amoA gene, ammonia-oxidizing bacteria (AOB) amoA gene, nirK, nirS, and nosZ genes normalized to sample volume (copy numbers/g dry soil) in the SM (A) and WW (B) seasons. Error bars indicate the standard deviation of three replicates. Differing letters indicate significant differences of means of each gene in pairwise comparisons (Duncan test; P < 0.05) for each treatment. Means followed by the same footnote symbol(s) for each gene are not significantly different at P < 0.05.
