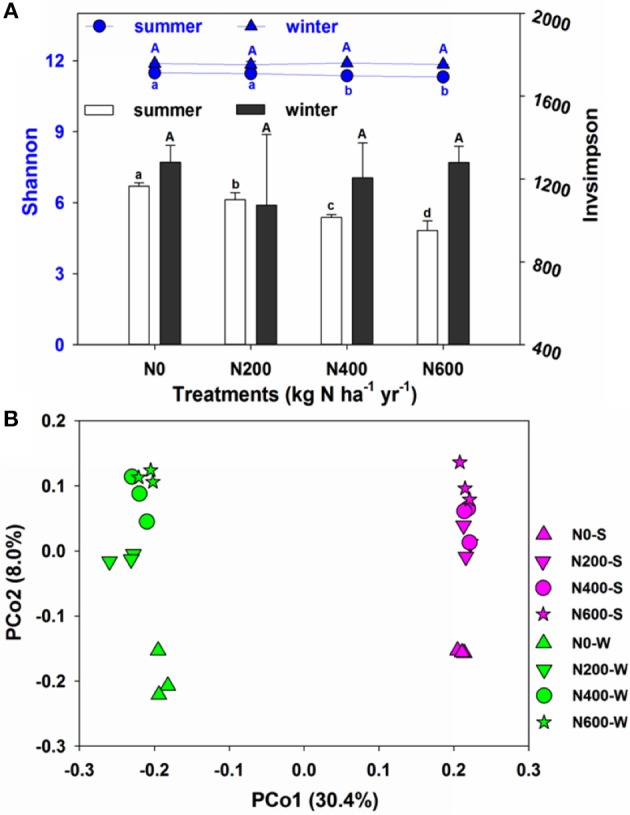
Figure 2.

(A) Shannon and Invsimpson of the bacterial communities in four fertilization gradients in the SM and WW seasons. (B) Principal coordinate analysis (PCoA) based on the Bray-Curtis distance showing the overall distribution pattern of bacterial communities in both SM and WW seasons.
