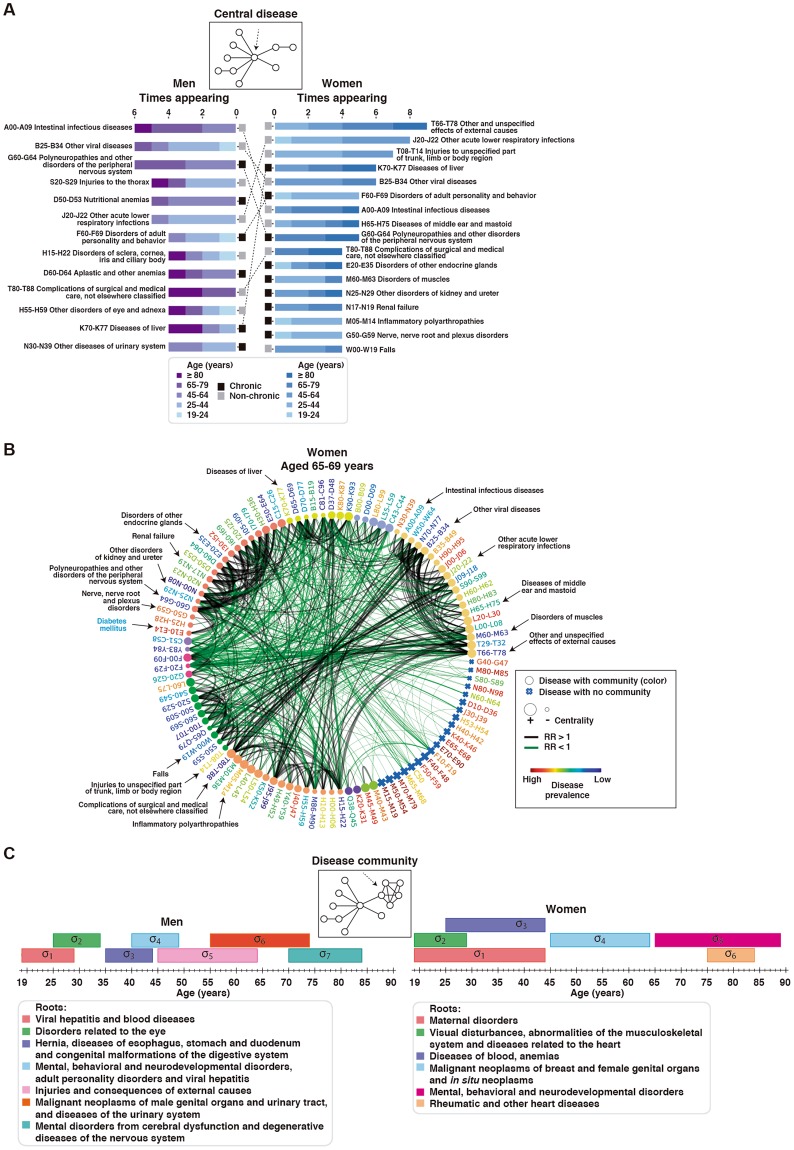
Figure 2.
Central diseases and network communities. (A) Diseases emerging as topologically central in men and/or women. The number of appearances (in different strata), the corresponding ages, and the specific condition (chronic or non-chronic) are shown. The dotted lines indicate diseases found to be common to men and women. (B) Disease network for women aged 65–69 years and depicting diseases (ICD-10 codes) identified as central in this gender. The node corresponding to “Diabetes mellitus” (not central) is also indicated (blue font). The node sizes reflect centrality value and their colors indicate communities. Edge thickness is proportional to the magnitude of the RR estimation; black indicates RR > 1.6 and green indicates RR < 0.8. Disease prevalence is shown by font colors as indicated in the inset. (C) Network communities appearing in at least two consecutive strata in men or women. The disease roots of each community are depicted in the insets.

