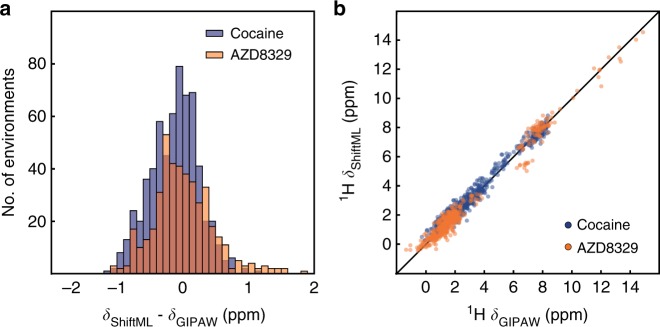
Fig. 4.
Comparison of predictions from ShiftML and GIPAW DFT for polymorphs of cocaine and AZD8329. a Histogram showing the distribution of the differences between 1H chemical shifts calculated with GIPAW and with ShiftML for the polymorphs of cocaine (blue), and the polymorphs of AZD8329 (orange). b Scatterplot showing the correlation between 1H chemical shifts calculated with GIPAW and ShiftML for cocaine (blue) and AZD8329 (orange). The black line indicates a perfect correlation

