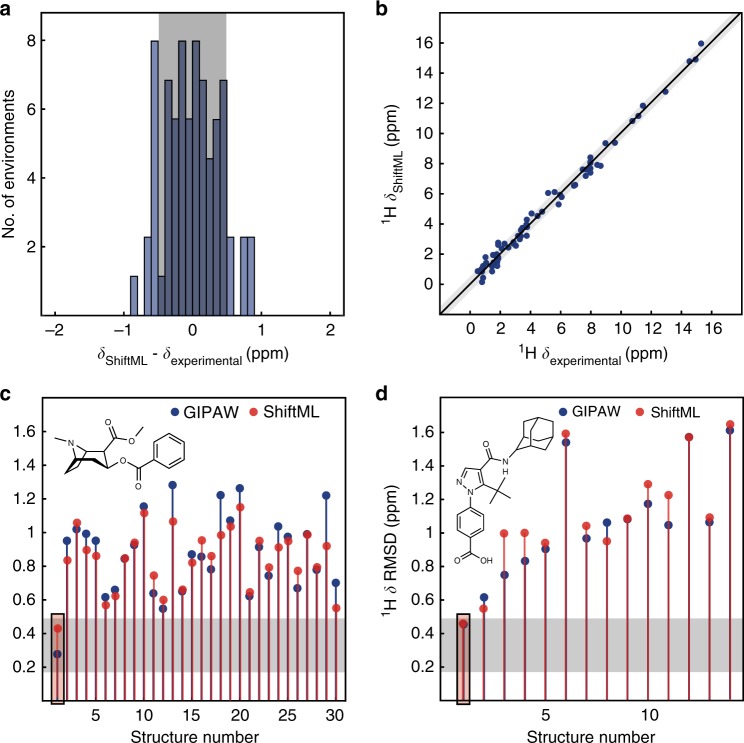
Fig. 5.
Comparison of ShiftML to experimentally measured shifts. a Histogram showing the distribution of differences between experimentally measured 1H chemical shifts and 1H chemical shifts calculated with ShiftML for six different crystal structures (see Supplementary Methods for the structures and numerical values of the shifts). b Scatterplot showing the correlation between these experimentally measured 1H chemical shifts and shifts calculated with ShiftML. c, d Comparison between calculated and experimental 1H chemical shifts for the most stable structures obtained with CSP for cocaine (c) and AZD8329 (d). For each candidate structure an aggregate RMSE is shown between experimentally measured shifts and shifts calculated using either GIPAW (blue) or ShiftML (red). The gray zones represent the confidence intervals of the GIPAW DFT 1H chemical shift RMSD, as described in the text13, and candidates (in c and d) that have RMSEs within this range would be determined as correct crystal structures using a chemical shift-driven solid-state NMR crystallography protocol

