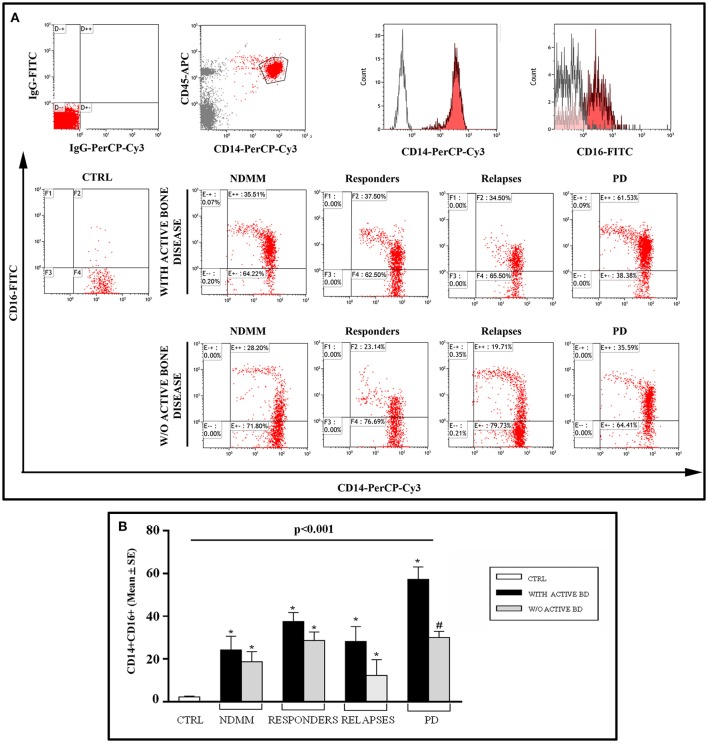
Figure 3.
CD14+/CD16+ monocytes in MM patients and controls. (A) Flow cytometry graphs show IgG-FITC and IgG-PerCP-Cy3 isotype controls, CD14+ monocytes gated on CD45+ cells, single stain of a representative CD14+ and CD16+ cells; dot plots show CD14+/CD16+ monocytes, from a representative control (CTRL) and representative patients with newly diagnosed multiple myeloma (NDMM), or responders, or at relapses or progressive disease (PD) without or with active bone disease (BD). (B) The histograms represent the mean values ± S.E. obtained from all the enrolled controls and patients. P < 0.001 for comparison of all groups (one-way ANOVA on ranks), and *P < 0.05 (Dunn's post-hoc test) vs. CTRL, #P < 0.05 with active BD vs. w/o active BD.

