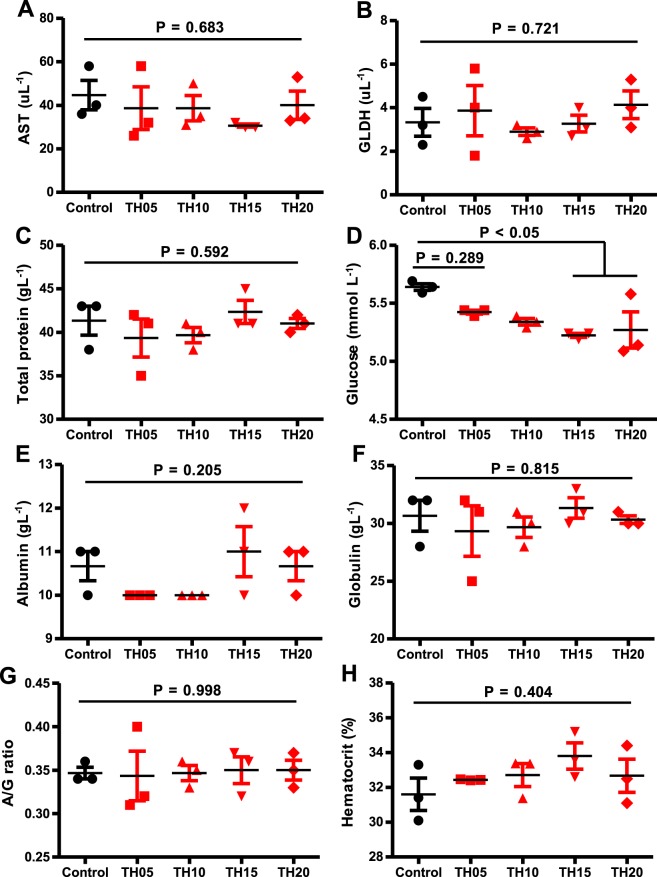
Figure 2.
Blood and serum biochemical parameters of juvenile barramundi fed tuna hydrolysate (TH) included diets at various levels for 8 weeks. X-axis represents the TH inclusion levels of 0 (control), 5, 10, 15 and 20 are considered as experimental treatments. (A) AST, aspartate transaminase (B) GLDH, glutamate dehydrogenase (C) total protein (D) glucose (E) globulin (F) albumin (G) A/G ratio (albumin/globulin ratio) and (H) hematocrit. Data were represented as mean ± S.E., n = 3. Post ANOVA Turkey multiple comparison test was applied to compare the mean value of each treatment with the mean value of the control. Mean values significantly different from the control are noted with P < 0.05.

