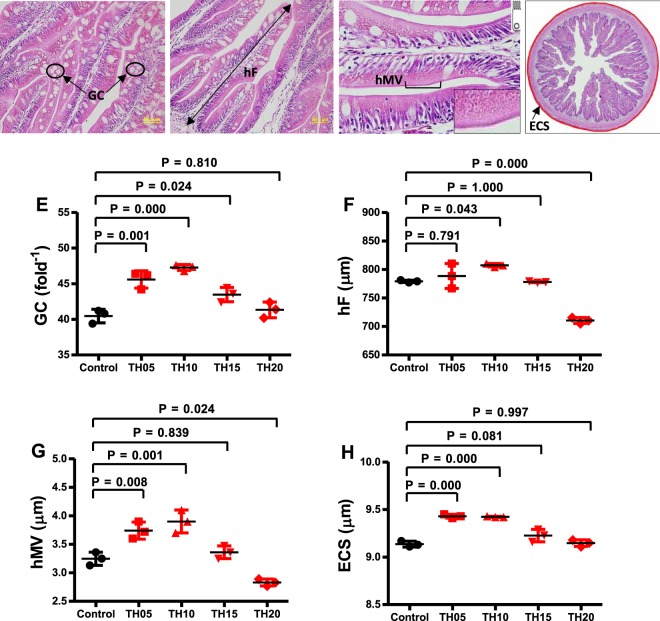
Figure 4.
Transverse sections of distal intestine photomicrograph of the juvenile barramundi (Panel A–D). All sections are stained with H&E. Scale bar, 50 μm, inset 20 µm. X-axis represents the TH inclusion levels of 0 (control), 5, 10, 15 and 20 are considered as experimental treatments (E–H). The distal intestine of juvenile barramundi is influenced by the inclusion of tuna hydrolysate (TH) in diets at varying levels for 8 weeks. The different measurements include GC = Goblet cells (Panel E), hF = fold height (Panel F), hMV = microvillous height (Panel G), ECS = external circumference of serosa (Panel H). Arrow point and cartoon with bracket both indicate hMV (Panel C). Data were represented as mean ± S.E., n = 5. Post ANOVA Tukey multiple comparison test was applied to compare the mean value of each treatment with the mean value of the control. Mean values significantly different from the control are noted with P < 0.05, P < 0.01 and P < 0.001.

