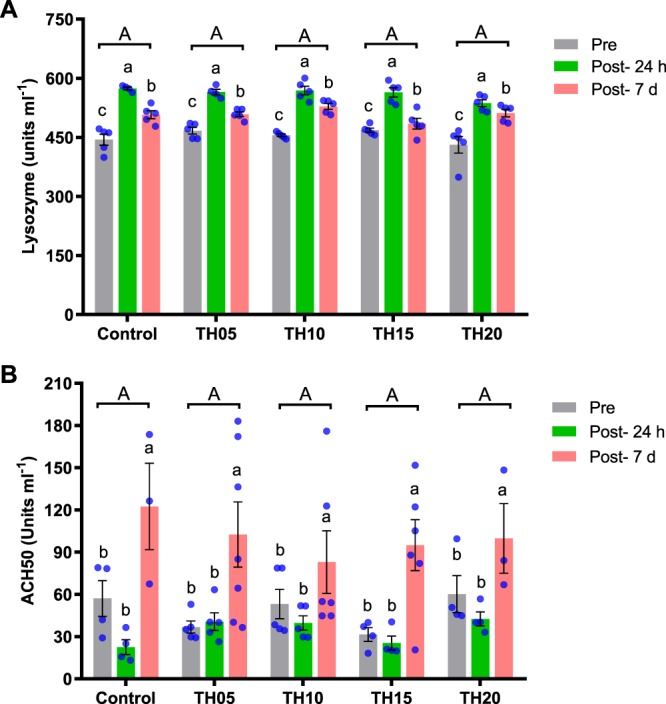
Figure 5.

Serum lysozyme (A) and complement (B) activities of juvenile barramundi fed TH diets at different inclusion levels for 8 weeks. Data were expressed as mean ± SE. X-axis represents the TH inclusion levels of 0 (control), 5, 10, 15 and 20 are considered as experimental treatments. Different lowercase letters (a,b,c) denote statistically significant differences among pre-challenge, post-challenge-24 h and post- challenge- 7 d in the same treatment. Bars holding same uppercase letter (A) among the different experimental treatments are not statistically significant. (Multifactorial ANOVA; Tukey post-hoc test; not significant P > 0.05; significant P < 0.05; P < 0.001).
