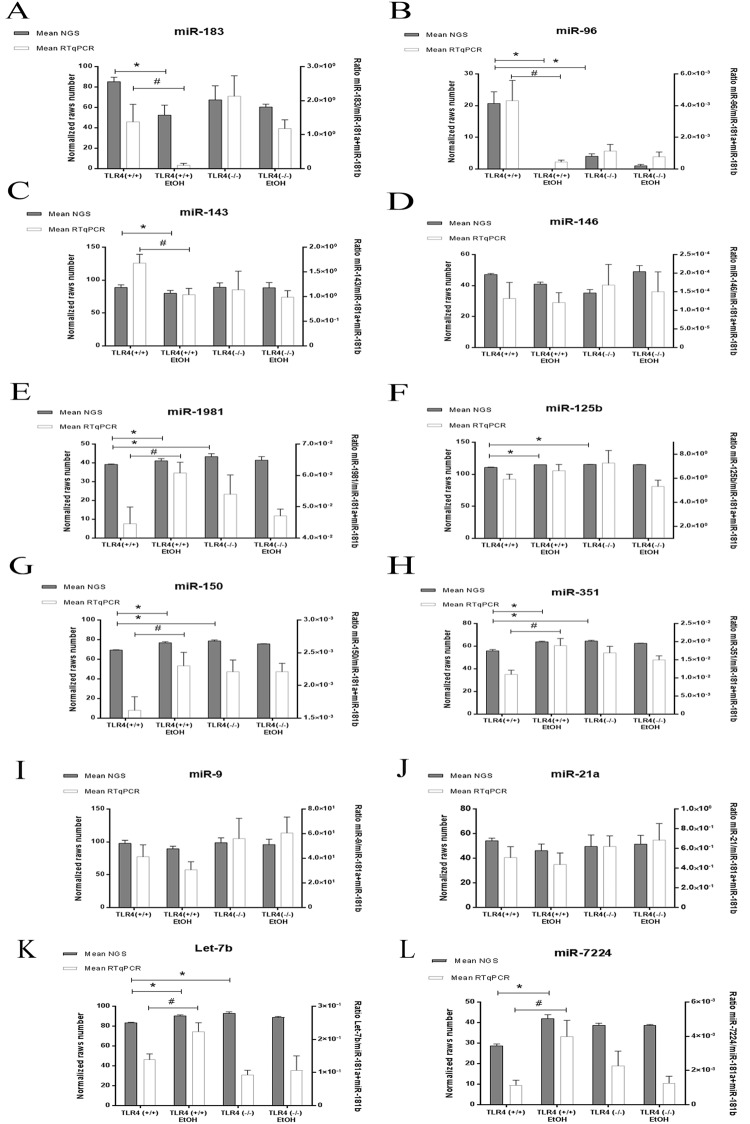
Figure 4.
RT-qPCR and NGS differential expression analysis. The graphics represent the NGS and RT-qPCR comparisons made in the cortices of the WT and TLR4-KO mice, with or without ethanol treatment (A–L). The NGS black bars denote the mean of the miRNAs raw reads of three independent biological samples (right scale bar). White bars represent the mean ratio of miRNAs obtained by the RT-qPCR analysis in nine individual tissues. Data were normalized with miR-181a and miR-181b. Bars are represented as [mean ± SEM]. *p < 0.05, **p < 0.01, ***p < 0.001 for the NGS data, and #p < 0.05, ##p < 0.01 (Student’s t-test).

