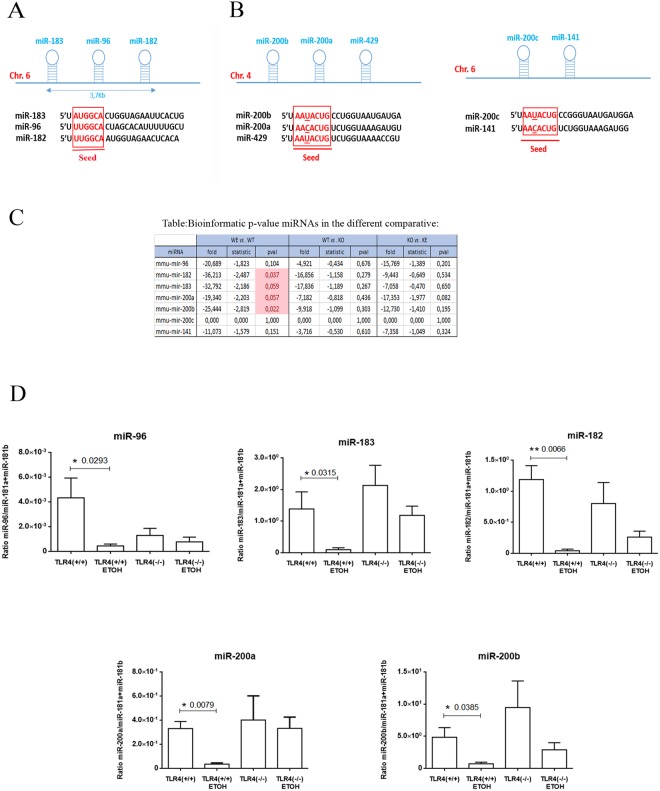
Figure 5.
Genomic organization, structure and expression of miR-183 and the miR-200 gene clusters involved in alcohol abuse and the TLR4 immune response. (A) Homology sequence with a conserved seed121 of the miR components of the mmu-miR-183 cluster (miRs-183, -96, -182) on assembly mouse (Chromosome (Chr.) 6, Chr.7 human homolog). (B) The miR-200 family forms two clusters located in different genomic regions: cluster I miR-200s (miR-200b, -200a, -429) and cluster II miR-200s (−200c, −141) located in assembly mouse (Chr. 4 and Chr. 6, respectively) and divided into two functional groups based on their seed sequences121. (C) NGS data show that ethanol treatment causes a statistical significant expression (fold change, statistic, p-value (pval), p-value adjusted (padj)) of the selected miRs (miR-96, -182, -183, -200a and -200b). (D) The RT-qPCR shows a differential expression at the levels of miR-183, miR-182, miR-96 (miR-183C), miR-200a and miR-200b in the cortices of the ethanol-treated vs. untreated WT and TLR4-KO mice. n = 9–11 independent experiments. *p < 0.05, **p < 0.01 (Student’s t-test).

