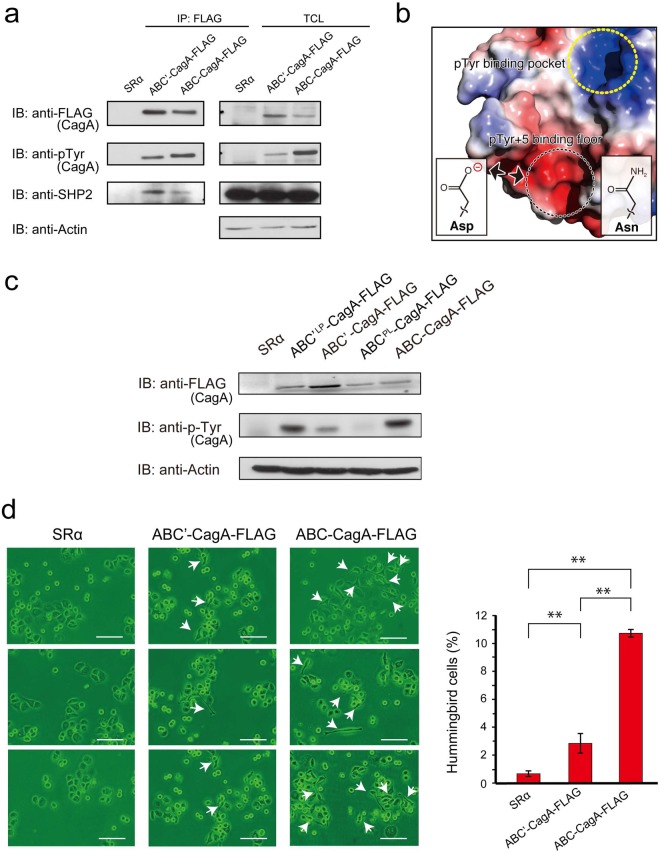
Figure 4.
SHP2-binding activity of Hp_TH2099 CagA. (a) AGS cells were transiently transfected with an ABC’-CagA-FLAG vector, an ABC-CagA-FLAG vector, or an empty control vector (SRα). Cell lysates were immunoprecipitated with an anti-FLAG antibody and the immunoprecipitates were subjected to immunoblotting analysis with the indicated antibodies. TCL: total cell lysate. IP: immunoprecipitate. Full-length blots are presented in Supplementary Figure S12. (b) CagA-binding interface of the SHP2 N-SH2 domain based on the data described previously39. Red-to-blue represents acidic-to-basic on the surface of the SHP2 N-SH2 domain. A dot circle in yellow indicates the region that interacts with the pTyr + 5 residue of the EPIYA-C segment. A dot circle in black indicates the region corresponding to the pTyr-binding pocket. (c) AGS cells were transiently transfected with an ABC’-CagA-FLAG vector, an ABC’LP-CagA-FLAG vector, an ABC-CagA-FLAG vector, an ABCPL-CagA-FLAG vector, or an empty control vector (SRα). In the ABC’LP-CagA-FLAG mutant, the ELIYA sequence in the EPIYA-C segment of ABC’-CagA-FLAG was replaced by the EPIYA sequence. In the ABCPL-CagA-FLAG mutant, the EPIYA sequence in the EPIYA-C segment of ABC-CagA-FLAG was replaced by the ELIYA sequence. Cell lysates were immunoprecipitated with an anti-FLAG antibody and the immunoprecipitates were subjected to immunoblotting analysis with the indicated antibodies. Full-length blots are presented in Supplementary Figure S12. (d) The morphology of AGS cells transfected with an ABC’-CagA-FLAG or an ABC-CagA-FLAG vector was examined under a microscope at 17 hours after transfection. Scale bars: 100 µm (left). Percentages of cells showing the hummingbird phenotype were calculated and statistically analyzed by using Student’s t-test. Error bars represent ± S.D. (n = 3), **p < 0.01. (right).

