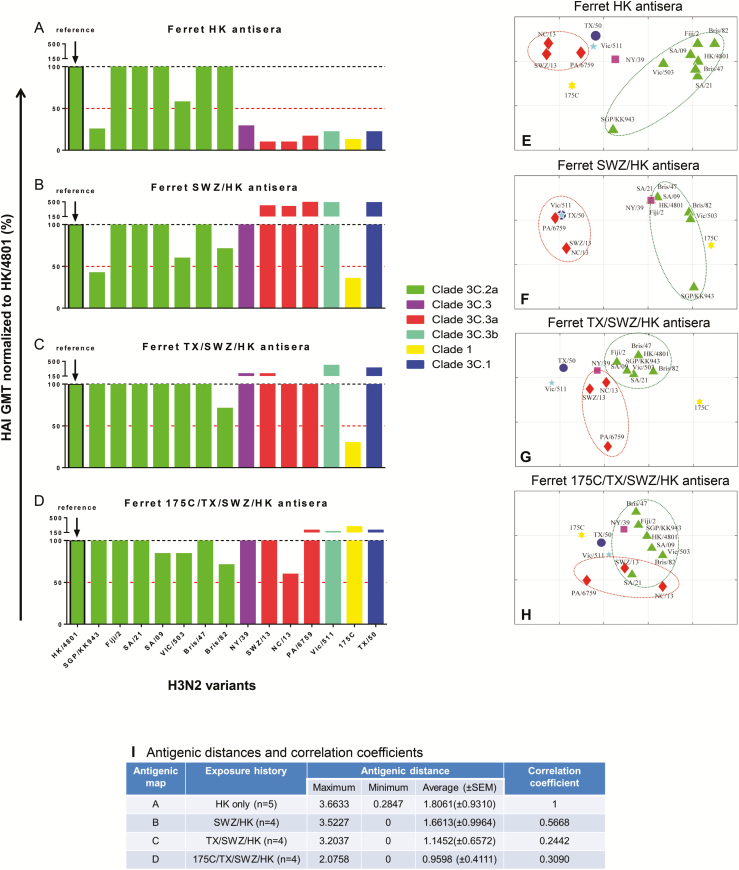
Figure 5.
H3 antigenic patterns determined by ferret antisera with different exposure histories. A–D, Normalized H3-specific ferret cross-reactive hemagglutination inhibition (HAI) geometric mean titers (GMTs). Egg-grown H3 viruses in the testing panel included clade 1, A/Uruguay/716/2007X175C (175C); clade 3C.1, A/Texas/50/2012 (TX/50); clade 3C.2a, A/Hong Kong/4801/2014 (HK/4801), A/Singapore/KK934/2014 (SGPKK934), A/Fiji/2/2015 (Fiji/2), A/South Australia/09/2015 (SA/09), A/South Australia/21/2015 (SA/21), A/Victoria/503/2015 (Vic/503), A/Brisbane/47/2015 (Bris/47), and A/Brisbane/82/2015 (Bris/82); clade 3C.3, A/New York/39/2012 (NY/39); clade 3C.3a, A/Switzerland/9715293/2013 (SWZ/13), A/North Carolina/13/2014 (NC/13), and A/Palau/6759/2014 (PA/14); clade 3C.3b, A/Victoria/511/2015 (Vic/511). Sera were collected from ferrets infected with HK (A), SWZ/HK (B), TX/SWZ/HK (C), or 175C/TX/SWZ/HK (D). (Please see the Figure 2 legend for descriptions of influenza virus strains.) Ferret HAI GMTs specific for individual H3 viruses are normalized to HK/4801-specific GMT with the red dotted lines indicating 50% response. E–H, Antigenic maps constructed using H3-specific HAI titers of ferret antisera. Each gridline (horizontal and vertical) in the antigenic maps represents 1 antigenic unit distance corresponding to a 2-fold difference in HAI titers. I, Antigenic distances (with standard error of the mean [SEM]) of H3 viruses determined in each ferret antigenic map and correlation analysis relative to ferret HK antisera-derived antigenic map. Correlation coefficients of 1, −1, and 0 represent a perfect positive correlation, a perfect negative correlation, and no correlation, respectively.

