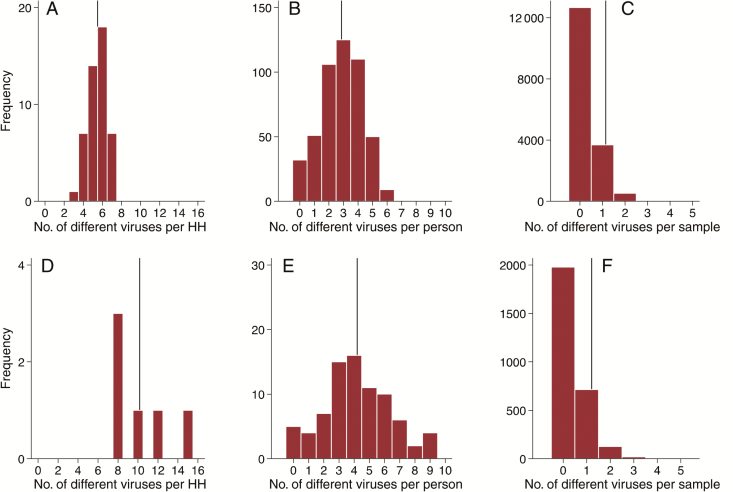
Figure 3.
Frequency distribution of the number of different viruses detected per (A & D) household, (B & E) person and (C & F) per sample over the study period. Panels A–C represent the screening for common respiratory pathogens in all the 47 households while panels D–F show full screening in the six households. The vertical lines represent the respective mean values.

