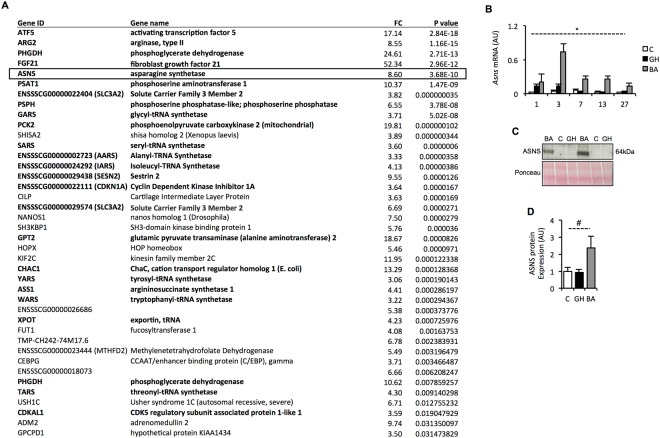
Figure 2.
Identification of Asparagine Synthetase (Asns) as a novel BA responsive gene. (A) Genes displaying >3-fold increase in expression with BA treatment at day 3 (relative to control) measured by RNA-sequencing. Genes ranked by significance (p < 0.05). (B) qPCR validation of Asns expression in all samples (Control, BA and GH; total n = 164). *p < 0.001 for time x treatment interaction (see Supplementary Table 2 for post hoc Bonferroni test comparisons). (C) Representative image of western blot for ASNS in control, BA and GH treated LD muscles at day 7 (see supplementary Figure 1 for full blot and gel). (D) Quantitation of ASNS protein abundance at day 7 from western blot. #p < 0.05 (ANOVA).

