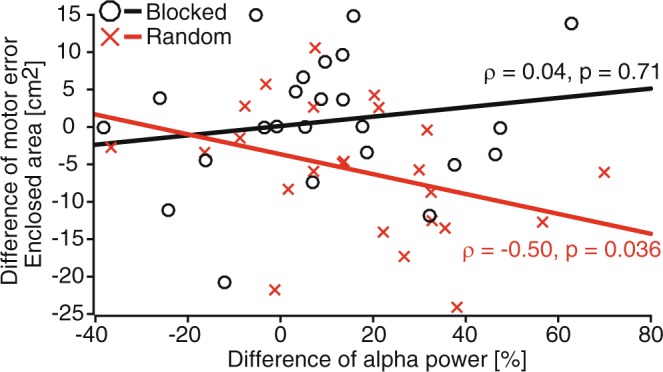
Figure 5.

Associations between Training-to-Posttest difference in motor error (quantified by the enclosed area) and alpha power (8–13 Hz) for ROIl (CP5, CP1, Pz, and P3) during motor execution were tested using Spearman’s correlation. Each red cross represents the data of a single participant from the Random group and each black circle represents a participant from the Blocked group. Lines represent a basic linear fit (red: Random; black: Blocked) and ρ represents Spearman’s rho with associated p-values.
