FIGURE 1.

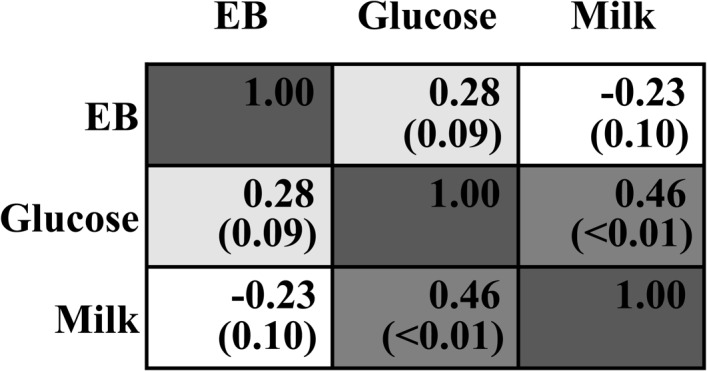
Correlation analysis between infused glucose level (Glucose), energy balance (EB), and milk production (Milk). The upper number within each cell means Pearson Correlation Coefficient. The lower number with the bracket means P-value.

Correlation analysis between infused glucose level (Glucose), energy balance (EB), and milk production (Milk). The upper number within each cell means Pearson Correlation Coefficient. The lower number with the bracket means P-value.