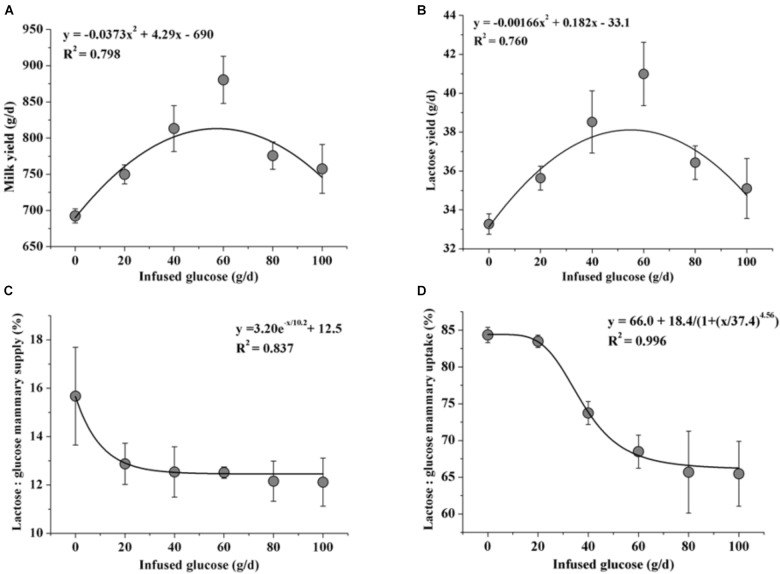
FIGURE 6.
Fitting curves of milk production [milk yield (A) and lactose yield (B)] and glucose utilization [the ratio of lactose yield and glucose mammary supply (C) and the ratio of lactose yield and glucose mammary uptake (D)] when 0–100 g/d of glucose was infused to the mammary gland. Error bar represents standard error.

