Fig. 4.
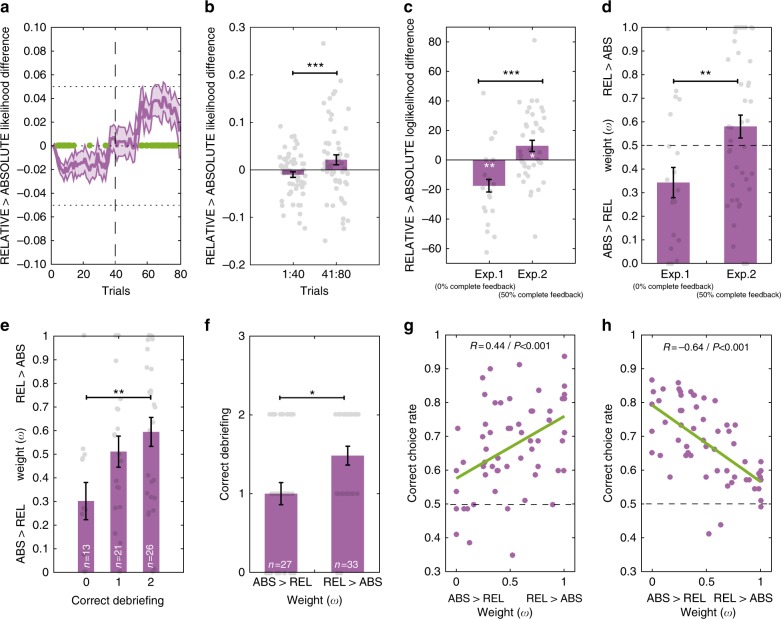
Computational properties and behavioral correlates of value normalization. a Likelihood difference (from model fitting) between the RELATIVE and the ABSOLUTE models over the 80 trials of the task sessions for both experiments (N = 60). A negative likelihood difference means that the ABSOLUTE model is the best-fitting model for the trial and a positive likelihood difference means that the RELATIVE model is the best-fitting model for the trial. Green dots: likelihood difference significantly different from 0 (P < 0.05, t-test). b Likelihood difference between the RELATIVE and the ABSOLUTE models over the first part of the task (40 first trials) and the last part (40 last trials) for both experiments. c Likelihood difference between the RELATIVE and the ABSOLUTE models for the two experiments. A negative likelihood difference means that the ABSOLUTE model is the best-fitting model for the experiment and a positive likelihood difference means that the RELATIVE model is the best-fitting model for the experiment. d Subject-specific free parameter weight (ω) comparison for the two experiments. e Subject-specific free parameter weight (ω) as a function of correct debriefing for the two questions (“fixed pairs” and “number of pairs”). f Debriefing as a function of the weight parameter. Small light gray dots above and below the bars in a–f represent individual subjects (N = 60). g and h Correct choice rate as a function of subjects’ weight parameter in the learning sessions and the transfer test for both Experiments 1 and 2. One dot corresponds to one participant (N = 60); green lines represent the linear regression calculations. Error bars represent s.e.m. ***P < 0.001, **P < 0.01, *P < 0.05, t-test

