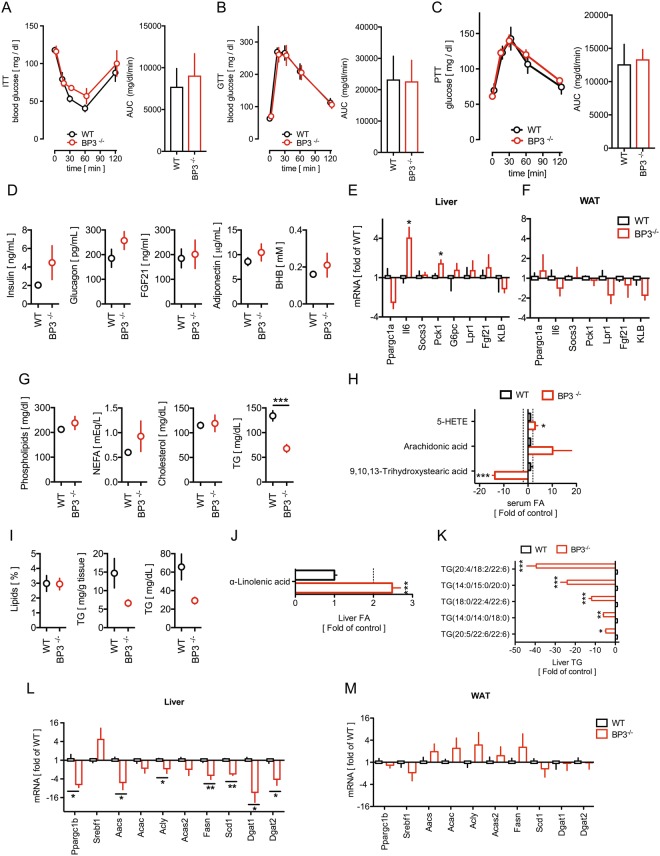
Figure 1.
BP3−/− mice show reduced serum and liver triglycerides. (A–C) Insulin tolerance test (ITT) (A); Glucose tolerance test (B) and Pyruvate tolerance test (C) and the respective Area under the curve (AUC) of WT and BP3−/− mice. Data were analyzed with two-way ANOVA followed by Bonferroni post tests; mean ± SEM; *P < 0.05; **P < 0.01 vs. WT control. (D) Insulin, glucagon, Fgf21, adiponectin and BHB serum concentrations of WT and BP3−/− mice. (E,F) Expression of genes involved in glucose homeostasis in livers (E) and WAT (F) from WT and BP3−/− mice determined by qRT-PCR. (G) Phospholipids, non-esterified fatty acids (NEFA), cholesterol, and overall triglycerides (TG) serum concentrations of WT and BP3−/− mice. (H) Metabolomics analysis of serum fatty acids. (I) Hepatic lipids and TG levels in WT and BP3−/− mice. (J,K) Metabolomics analysis of linolenic acid (J) and TG isomers (K) in WT and BP3−/− mice. (L,M) Expression of genes involved in lipogenesis in livers and WAT from WT and BP3−/− mice. Data are expressed as fold of WT control (E,F,L,M). Data are expressed as mean ± SEM; n = 6–10, *P < 0.05; **P < 0.01; ***P < 0.0001 vs WT control.

