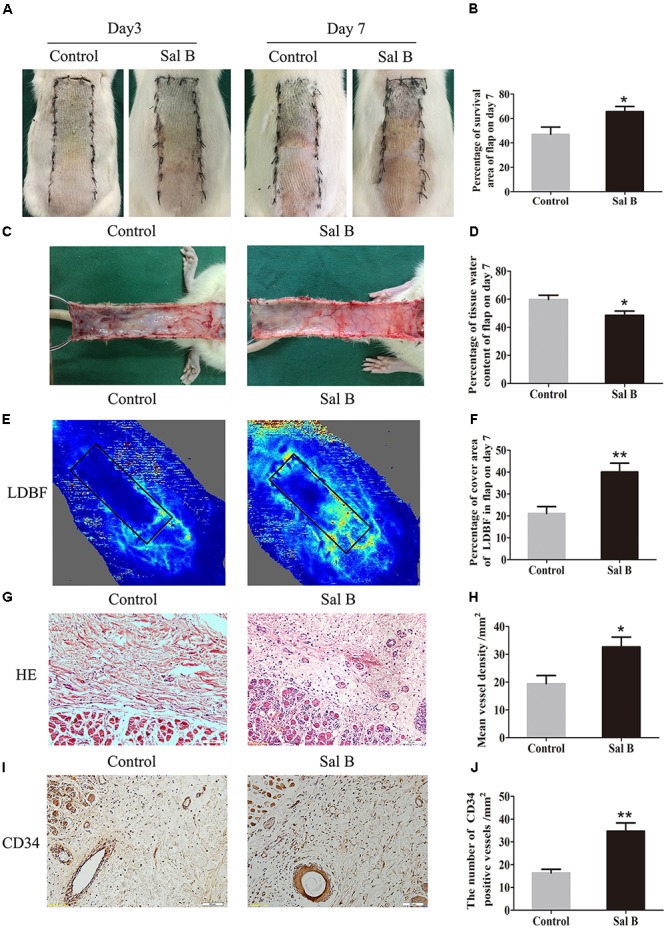
FIGURE 1.

Effects of Sal B on random skin flaps vitality. (A) Digital photographs of flap survival of the Control and Sal B group on post-operative days 3 and 7 (scale bar: 2 cm). (B) Histogram of percentages of flap survival area on post-operative day 7. (C) Digital photographs of the inner side of skin flaps in each group on post-operative day 7 showing tissue edema (scale bar: 2 cm). (D) Histogram of percentages of tissue water content of skin flaps. (E) LDBF imaging showing vascular flow and blood supply in skin flaps on post-operative day 7 (scale bar: 2 cm). (F) Histogram of percentages of area of blood supply. (G) H&E staining of microvessels in area II of skin flaps (original magnification, 200×; scale bar: 50 μm). (H) Histogram of MVDs by H&E staining. (I) IHC for CD34 in area II of skin flaps (original magnification: 200×; scale bar: 50 μm). (J) Histogram of CD34-positive vessel densities. ∗p < 0.05 and ∗∗p < 0.01 vs. the control group. Data are means ± SEM (n = 6 per group).
