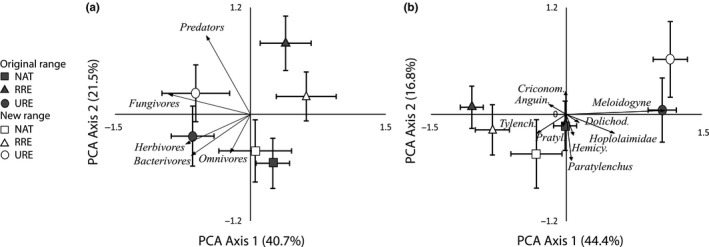
Figure 1.

Ordination diagrams of principal component analyses (PCA) showing the centroids of nematode community composition based on nematode feeding types (left) and the community of root‐feeding nematodes (right). Centroids represent nematode communities in mesocosms inoculated with soils from the original range (filled signs) or new range (open signs), grown with either natives (NAT; squares), related range expanders (RRE; triangles), or unrelated range expanders (URE; circles). Arrows represent the relation between nematode feeding types (a) or between root‐feeding nematode taxa (b) and the variation in nematode community along the PCA axes. Horizontal and vertical error bars represent standard errors along the first and second PCA axes. Percentages of total explained variation by the PCA axes are given in the parentheses
