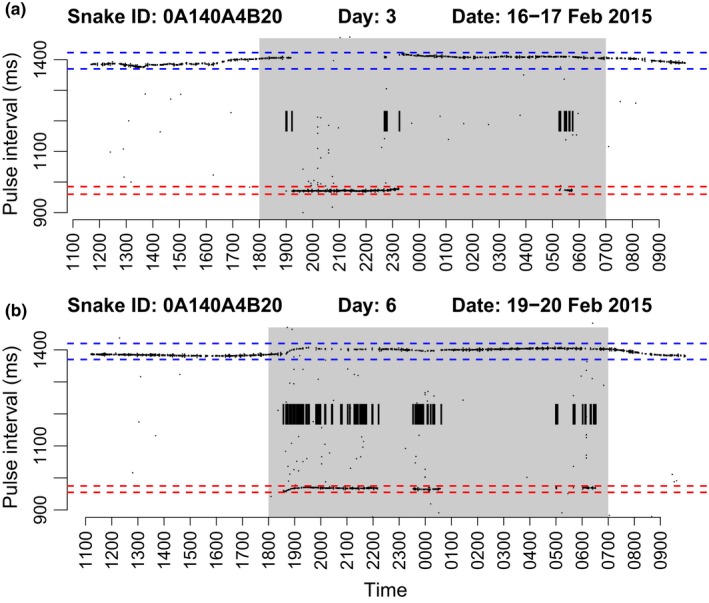
Figure 2.

Nightly activity plots from the same snake during low (a) and high (b) activity periods. Shaded gray areas indicate hours of darkness from 1800 to 0700. Blue and red dashed lines represent ranges of pulse interval states. Black lines at y = 1200 indicate state transitions (“tips” of the transmitter) identified by the postprocessing algorithm
