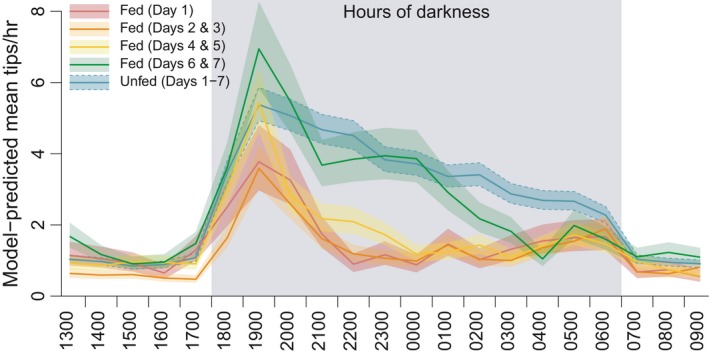
Figure 4.

Hourly predicted activity rates based on post hoc pooling of treatment group data by days postfeeding, and pooling all control group days into a single level. Shaded areas represent ± 1 standard error of the estimate

Hourly predicted activity rates based on post hoc pooling of treatment group data by days postfeeding, and pooling all control group days into a single level. Shaded areas represent ± 1 standard error of the estimate