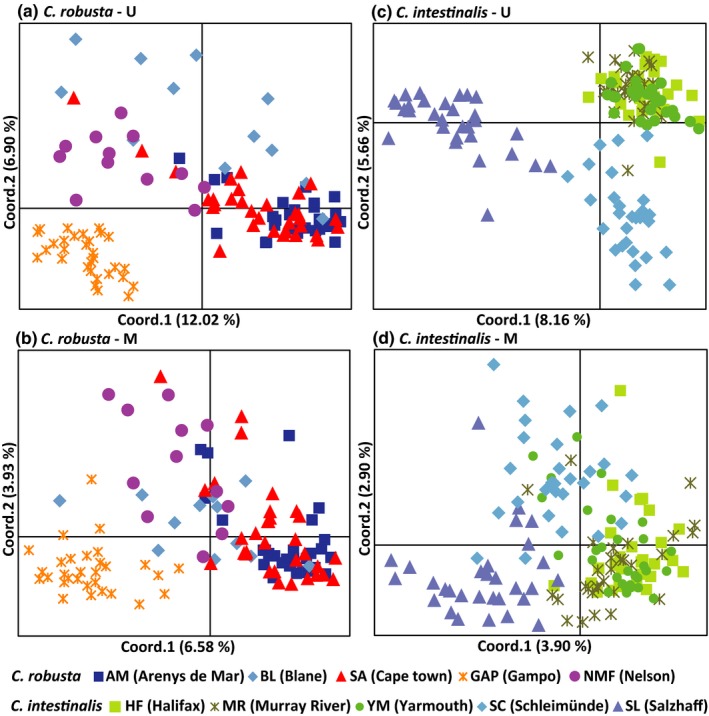
Figure 3.

Principal coordinates analysis (PCoA) of U and M profiles for Ciona robusta and C. intestinalis. The first two coordinates are displayed with the indication of the percentage of variance explained in brackets. Populations collected from the same regions are represented by different shades of the same colors
