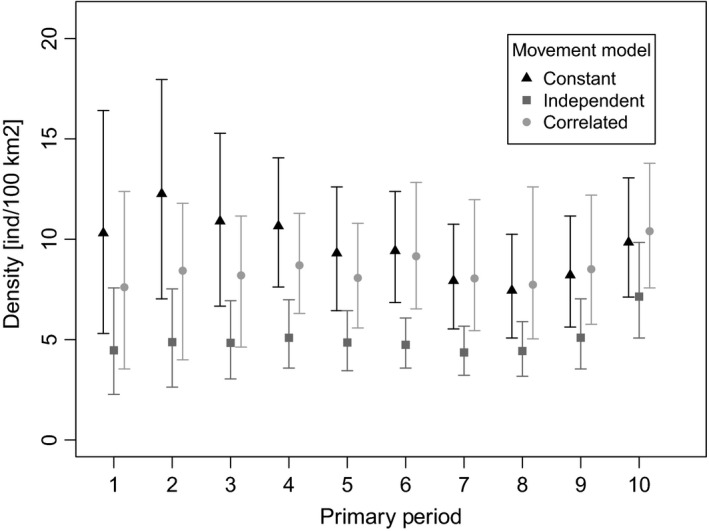
Figure 2.

Estimates of tiger density (individuals/100 km2) from Nagarahole reserve, India, based on camera‐trapping data from 1991 to 2000 using open spatial capture–recapture models; bars represent 95% Bayesian credible intervals. Three different models for the activity centers are shown: constant activity centers in triangles, independent activity centers in squares, and correlated activity centers in circles. Results are shown for a state space based on a 15‐km trap array buffer
