
Figure 3.
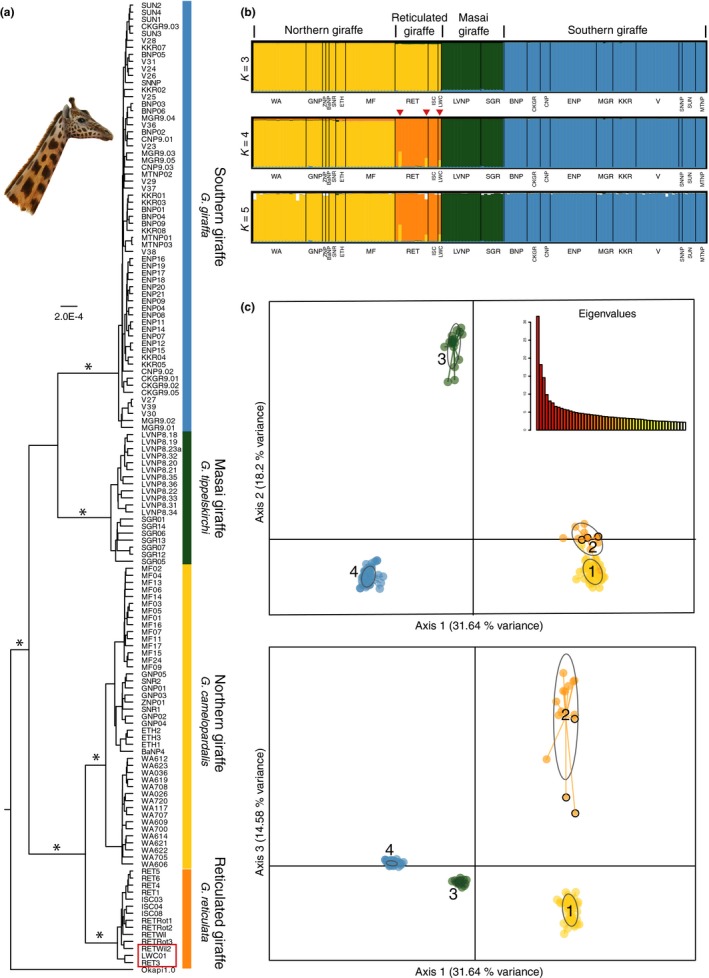
Nuclear phylogeny and population structuring of giraffe. (a) Bayesian multi‐locus tree from 21 nuclear loci and 137 giraffe individuals reconstruct four significant supported (p ≥ 0.95) giraffe clades, corresponding to the four giraffe species (Fennessy et al., 2016). The okapi is used as the outgroup. The asterisks indicate branches with statistical significant support (p ≥ 0.95). The red frame indicates the potential hybrids. (b) STRUCTURE analysis of the dataset, excluding the okapi. The colors indicate the membership in a cluster for each sampling location and individual. K = 4 shows four well‐resolved groups and is supported as best fitting number of clusters by several statistical methods (see Supporting information Figure S2). The grouping into four clusters is consistent with the Bayesian multi‐locus analysis: yellow: northern giraffe, orange: reticulated giraffe, green: Masai giraffe, and blue: southern giraffe. Three individuals within the reticulated giraffe cluster (red arrowheads) indicate potential hybridization with admixture from the northern giraffe. K = 3 merges northern and reticulated giraffe, and at K ≥ 5 no further clustering is evident. (c) PCA axes 1‐2 and axes 1‐3 for four distinct giraffe clusters (1: northern; 2: reticulated; 3: Masai; 4: southern). Colors as in Figure 3b. The 95% confidence intervals are shown as oval outlines. Note that the nonoverlapping confidential intervals in the PCA axes 1‐2, as well as, axes 1‐3 indicate significantly different clusters. Potential hybrids are indicated by black circles. Note. The drawing by Jon B. Hlidberg shows a Nubian giraffe