Figure 2.

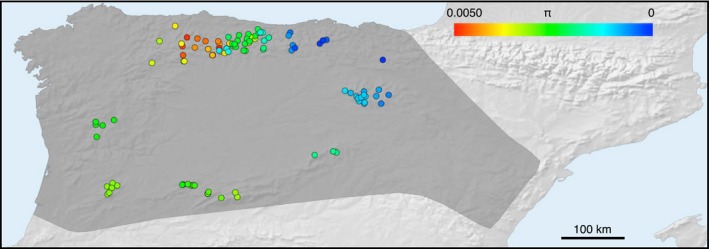
Map showing mitochondrial nucleotide diversity around each sampling point. The upper scale indicates nucleotide diversity (π) values

Map showing mitochondrial nucleotide diversity around each sampling point. The upper scale indicates nucleotide diversity (π) values