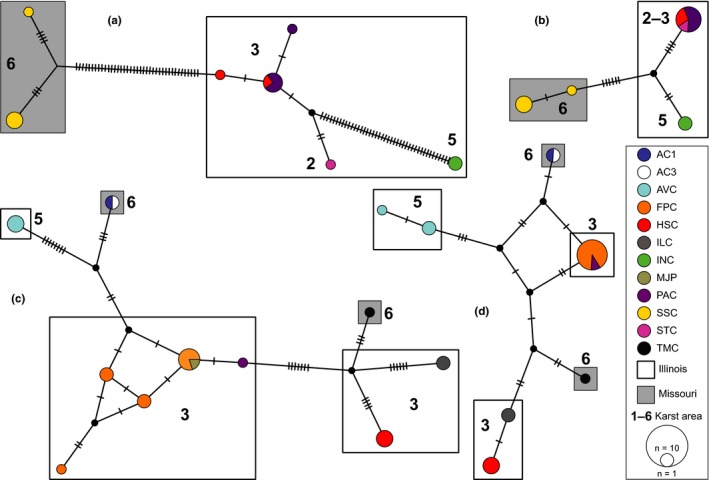
Figure 5.

TCS haplotype networks of Pygmarrhopalites A10 (a, COI; b, 16S) and Pogonognathellus T4 (c, COI; d, 16S). Hatch marks represent mutational steps between haplotypes; circle color indicates cave locality as illustrated in the legend; numbers 1–6 represent sinkhole karst area (see Table 1; Figure 1); rectangle color indicates position relative to the Mississippi River (white, Illinois; gray, Missouri); node diameter represents sample size
