
Figure 6.
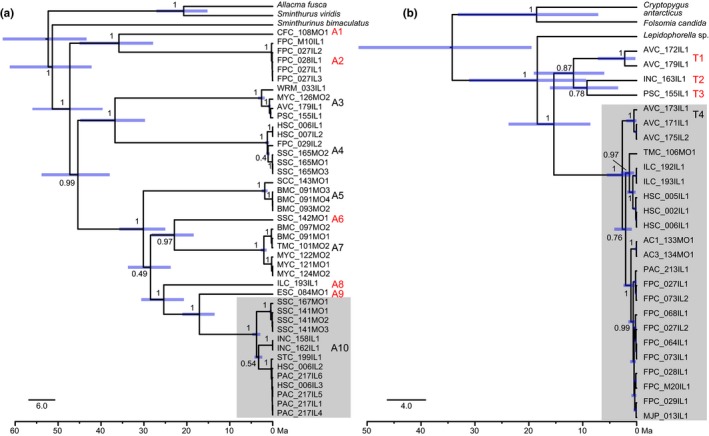
Time‐calibrated trees for (a) Pygmarrhopalites and (b) Pogonognathellus inferred by Bayesian phylogenetic analysis. Clade posterior probabilities are indicated at each node. Divergence times are represented by blue bars at each node with their length corresponding to the 95% HPD of node ages. OTUs identified by the GMYC analysis are indicated to the right of each clade (A1–A10 and T1–T4). Focal OTUs chosen for population structure analyses (A10 and T4) are highlighted in gray boxes (see Figure 7 for close‐up of A10). Single‐site endemic OTUs are labeled in red. Taxon labels correspond to cave name abbreviation, sample #, state, specimen # (see Table 1 for cave abbreviations and Appendix 1 for sample information). Scale bars represent substitutions/site/Ma