
Figure 5.
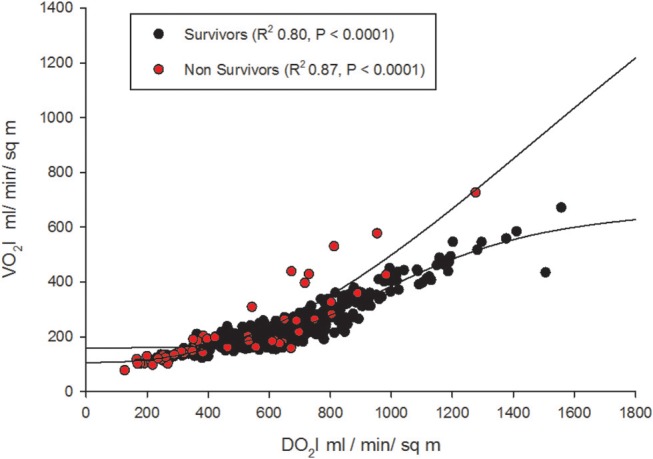
Oxygen supply-dependence graphs (with non-linear logistic regression curves) amongst survivors and non-survivors.
Official websites use .gov
A
.gov website belongs to an official
government organization in the United States.
Secure .gov websites use HTTPS
A lock (
) or https:// means you've safely
connected to the .gov website. Share sensitive
information only on official, secure websites.
Oxygen supply-dependence graphs (with non-linear logistic regression curves) amongst survivors and non-survivors.