
Figure 3.
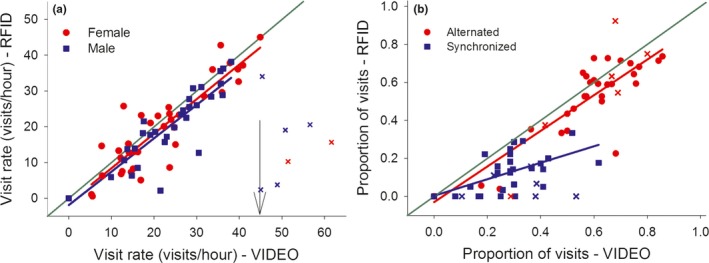
Radio‐frequency identification (RFID) data validation with the corresponding video data (N = 38) for three behavioral parameters. The thin green line in both panels exemplifies the most ideal situation where data by both methods are a perfect match. Panel a: male (blue squares) and female (red dots) visit rates, with the arrow pointing at 45 visits/hr, a threshold after which the RFID data becomes a poor match of the video data. Data generated by individuals with visit rates beyond this threshold are characterized by “x” in both panels. Panel b represents data validation for the proportion of alternated (red dots) and synchronized (blue squares) visits