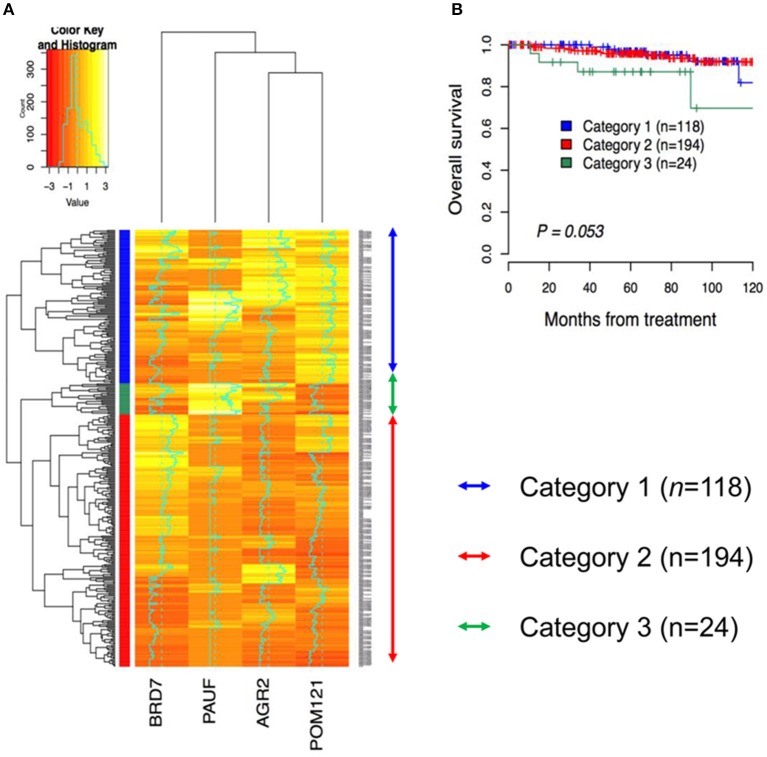
Figure 3.
Hierarchical clustering analysis for immunohistochemical expression of PAUF-associated proteins in cervical cancer patients. (A) Three cluster groups were identified in the present study. Category 1 (n = 118, blue arrow) consists of relatively high AGR2 and POM121 expression. Category 2 (n = 194, red arrow) consists of relatively low AGR2 and PAUF expression. Category 3 (n = 24, green arrow) consists of relatively high PAUF and low POM121 expression. (B) Kaplan–Meier plot for overall survival according to group by hierarchical clustering. A tendency toward decreased overall survival was observed in Category 3 than in the other groups (log-rank test, p = 0.053).

