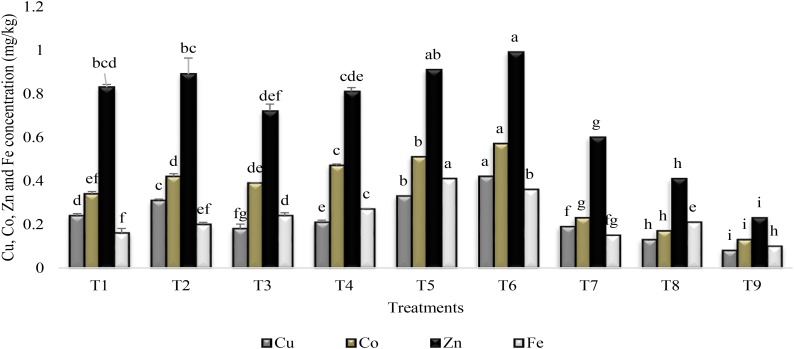
FIGURE 3.
Micronutrients accumulation in the rhizosphere of sunflower grown under drought stress and control conditions and treated with PGPR/SA. Error bars represent standard errors of the mean (n = 4) at each time point. Different letters indicate significant differences (P < 0.05) among treatments.

