FIGURE 1.

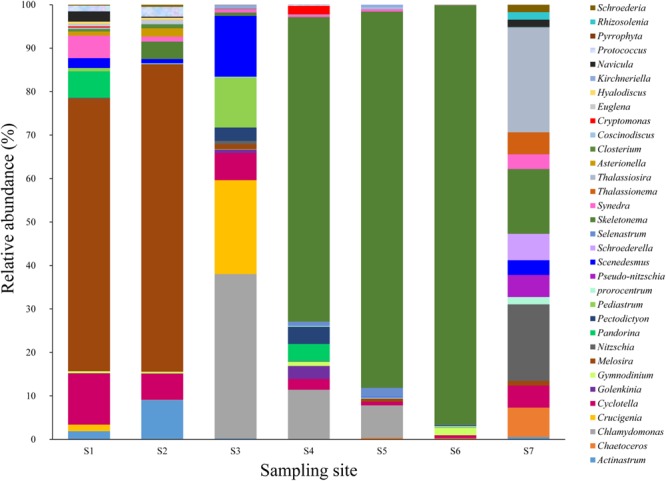
Microalgal composition (at the genus level) at all surface sampling sites. Y-axis represents the relative abundance of microalgae. X-axis represents the sampling sites.

Microalgal composition (at the genus level) at all surface sampling sites. Y-axis represents the relative abundance of microalgae. X-axis represents the sampling sites.