Figure 4.
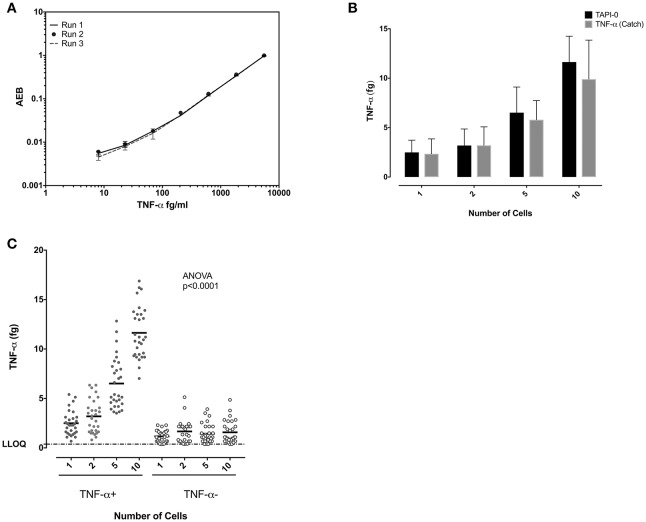
Quantification of TNF-α in single CD8 T cells. (A) Reproducibility of the SiMoA standard curves for TNF-α. Standard concentrations of TNF-α were used to generate curve to calculate the unknown concentrations in cells. (B) Comparison of TNF-α concentrations using TAPI-0 and bispecific catch reagent assays. The assays were found to yield similar results. (C) Comparison of measured TNF-α protein at 1, 2, 5, and10 cell levels in CD8 T cells. The amount of TNF-α measured in femtograms of lysates from TNF-α -producing cells or cells not producing TNF-α. Horizontal axis is number of cells sorted into each lysate. Left are data from TNF-α-surface positive cells, right are data from TNF-α-cell surface negative cells. Data are represented as mean and mean ± SD and differences among means were calculated using one-way ANOVA with Dunnett's multiple comparisons post-test. P < 0.05 were considered significant.

